2012 United States presidential election in Massachusetts

Last updated

2012 United States presidential election in Massachusetts
Flag of Massachusetts.svg
  2008 November 6, 2012 2016  
Turnout73.2% Decrease2.svg
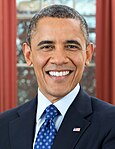
  President Barack Obama, 2012 portrait crop.jpg Mitt Romney by Gage Skidmore 6 cropped.jpg
Nominee Barack Obama Mitt Romney
Party Democratic Republican
Home state Illinois Massachusetts
Running mate Joe Biden Paul Ryan
Electoral vote110
Popular vote1,921,7611,188,460
Percentage60.67%37.52%

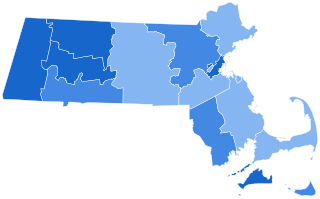
Massachusetts Presidential Election Results 2012.svg
2012 Presidential election in Massachusetts voting results by municipality.svg
MA President 2012.svg

President before election

Barack Obama
Democratic

Elected President

Barack Obama
Democratic

The 2012 United States presidential election in Massachusetts took place on November 6, 2012, as part of the 2012 United States presidential election in which all 50 states plus the District of Columbia participated. Massachusetts voters chose 11 electors to represent them in the Electoral College via a popular vote pitting incumbent Democratic President Barack Obama and his running mate, Vice President Joe Biden, against Republican challenger and former Massachusetts Governor Mitt Romney and his running mate, Congressman Paul Ryan.

Contents

Obama and Biden won Massachusetts with 60.67% of the popular vote to Romney's and Ryan's 37.52%, thus winning the state's 11 electoral votes by a 23.15% margin of victory, despite Massachusetts being Romney's home state where he served as governor from 2003 to 2007. [1] This was the first time a presidential candidate lost his home state since Al Gore lost Tennessee in the 2000 election. Romney also became the first Republican candidate to lose his home state since Richard Nixon lost his then-home state of New York to Hubert Humphrey in 1968.

Massachusetts had been a Democratic-leaning state since 1928, and a Democratic stronghold since 1960, and has maintained extremely large Democratic margins since 1996. Even fending off one of the state's own former governors, Mitt Romney. Massachusetts has not voted for a Republican presidential candidate since Ronald Reagan in 1984. The 2012 election was also the sixth consecutive one (since 1992) in which the Democratic presidential candidate swept every one of the state's 14 counties. Romney became the first major party nominee to lose their home state by twenty or more percentage points in 80 years, which would happen again four years later when Donald Trump lost his then-home state of New York by 22 points.

Nevertheless, Romney's 37.52% vote share still stands as of the 2020 presidential election as the highest Republican vote share in Massachusetts since 1988. Romney's 4.20% defeat in Plymouth County represents, as of 2020, the closest a Republican has come to carrying any of Massachusetts' counties since 1988.

The 2012 presidential election marks the most recent cycle that Romney would stand for public office as a resident of Massachusetts. He would be on the ballot again in 2018, but as a candidate for U.S. senator from Utah. Despite Romney's expected wide loss, this is to date the best performance of a Republican presidential candidate in Massachusetts since George H. W. Bush in 1988, when he garnered more than 40% of the state's votes and won four of its counties (making him the most recent Republican to win any Massachusetts counties). Romney outperformed George W. Bush's vote share in 2004 by 0.74%, while Obama underperformed John Kerry's vote share by 1.27%. Obama's 23% margin was the smallest margin since 1992.

Primary elections

Democratic primary

2012 Massachusetts Democratic presidential primary
Flag of Massachusetts.svg
  2008 March 6, 2012 (2012-03-06) 2016  
  President Barack Obama, 2012 portrait crop.jpg
Candidate Barack Obama
Party Democratic
Home state Illinois
Delegate count110
Popular vote127,909
Percentage86.50%

Massachusetts Demcoratic Presidential Primary Election Results by County, 2012.svg
Massachusetts results by county
  Barack Obama

Incumbent president Barack Obama won the Massachusetts Democratic Primary with 81% of the vote. [2] [3] He received no official opposition in the primary, with the other 19% of the vote going to "no preference," write-in candidates, or blank ballots. Through the primary and district caucuses, he won all of the state's 110 pledged delegates, which voted for him at the 2012 Democratic National Convention in Charlotte, North Carolina (the state also had 26 superdelegates). [3]

Massachusetts Democratic primary, 2012 [2] [3]
CandidateVotesPercentageDelegates
Barack Obama 127,90986.50%110
No preference16,07510.87%0
Write-ins 3,8892.63%0
Totals147,873100.00%110

Republican primary

2012 Massachusetts Republican presidential primary
Flag of Massachusetts.svg
  2008 March 6, 2012 (2012-03-06) 2016  
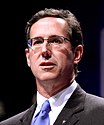
  Mitt Romney by Gage Skidmore 6 cropped.jpg Rick Santorum by Gage Skidmore.jpg Ron Paul by Gage Skidmore 3 (crop 2).jpg
Candidate Mitt Romney Rick Santorum Ron Paul
Home state Massachusetts Pennsylvania Texas
Delegate count3800
Popular vote266,31344,56435,219
Percentage71.89%12.03%9.51%

Massachusetts Republican Presidential Primary Election Results by County, 2012.svg
Massachusetts results by county
  Mitt Romney

The 2012 Massachusetts Republican presidential primary was held on March 6, 2012. [4] [5] Among the 41 delegates to the Republican National Convention, 38 are awarded proportionately among candidates getting at least 15% of the vote statewide, and another three super delegates are unbound. [6] As expected, Romney won Massachusetts by a landslide. He won the plurality in every town but 10 (Rick Santorum won seven, Ron Paul won two, and no candidate won one), and earned the majority in all but 53. [7]

Massachusetts Republican primary, 2012 [8]
CandidateVotesPercentageProjected delegate count
AP CNN
[9]
FOX
[10]
Mitt Romney 266,31371.89%-3838
Rick Santorum 44,56412.03%-00
Ron Paul 35,2199.51%-00
Newt Gingrich 16,9914.59%-00
Jon Huntsman (withdrawn)2,2680.61%-00
Rick Perry (withdrawn)9910.27%-00
Michele Bachmann (withdrawn)8650.23%-00
No preference1,7930.48%-00
Blanks8180.22%-00
Others6130.17%-00
Unprojected delegates:4133
Total:370,425100.00%414141

Green-Rainbow primary

2012 Massachusetts Green-Rainbow presidential primary
Flag of Massachusetts.svg
  2008 March 6, 2012 (2012-03-06) 2016  
  Jill Stein by Gage Skidmore (1).jpg Kent Mesplay by Gage Skidmore (1).jpg 3x4.svg
Candidate Jill Stein Kent MesplayHarley Mikkelson
Party Green Green Green
Home state Massachusetts California
Delegate count811
Popular vote1,0188984
Percentage67.06%5.86%5.53%

The 2012 Massachusetts Green-Rainbow presidential primary was held on March 6, 2012.

Massachusetts Green-Rainbow primary, 2012 [11]
CandidateVotesPercentageDelegates
Jill Stein 1,01867.06%8
No preference23215.28%2
Kent Mesplay895.86%1
Harley Mikkelson845.53%1
Write-ins 956.26%0
Totals1,518100.00%11

General election

Candidate Ballot Access

Results

2012 United States presidential election in Massachusetts [12]
PartyCandidateRunning mateVotesPercentageElectoral votes
Democratic Barack Obama Joe Biden 1,921,76160.67%11
Republican Mitt Romney Paul Ryan 1,188,46037.52%0
Libertarian Gary Johnson Jim Gray 30,9200.98%0
Green-Rainbow Jill Stein Cheri Honkala 20,6910.65%0
OthersOthers6,5520.21%0
Totals3,167,767100.00%11

By county

CountyBarack Obama
Democratic
Mitt Romney
Republican
Various candidates
Other parties
MarginTotal votes cast
# %# %# %# %
Barnstable 70,82253.20%60,44645.41%1,8471.39%10,3767.79%133,115
Berkshire 48,84375.74%14,25222.10%1,3912.16%34,59153.64%64,486
Bristol 143,43359.39%93,89838.88%4,1781.73%49,53520.51%241,509
Dukes 7,97872.74%2,79225.46%1981.80%5,18647.28%10,968
Essex 210,30257.40%150,48041.07%5,5751.53%59,82216.33%366,357
Franklin 27,07271.70%9,34424.75%1,3423.55%17,72846.95%37,758
Hampden 123,61961.69%73,39236.62%3,3881.69%50,22725.07%200,399
Hampshire 57,35970.27%21,48026.32%2,7823.41%35,87943.95%81,621
Middlesex 471,80462.56%267,32135.45%15,0451.99%204,48327.11%754,170
Nantucket 3,83062.58%2,18735.74%1031.68%1,64326.84%6,120
Norfolk 202,71456.86%148,39341.62%5,4161.52%54,32115.24%356,523
Plymouth 131,84551.40%121,08647.20%3,6001.40%10,7594.20%256,531
Suffolk 223,89677.45%59,99920.75%5,2031.80%163,89756.70%289,098
Worcester 198,24453.71%163,39044.27%7,4782.02%34,8549.44%369,112
Totals1,921,76160.67%1,188,46037.52%57,5461.82%733,30123.15%3,167,767

Results by Municipality

CountyBarack Obama

Democratic

Mitt Romney

Republican

Various Candidates

Other parties

Total votes cast
%#%#%#
Abington 49.8%4,10449.1%4,0511.1%898,244
Acton 65.7%7,77932.5%3,8511.8%21811,848
Acushnet 57.1%3,02141.3%2,1831.6%855,289
Adams 77.1%3,01020.9%8182.0%773,905
Agawam 50.8%7,28847.9%6,8701.4%19614,354
Alford 76.6%23321.1%642.3%7304
Amesbury 57.4%4,81741.0%3,4461.6%1338,396
Amherst 82.8%12,31612.6%1,8724.7%69514,883
Andover 49.9%9,28748.7%9,0531.4%25818,598
Aquinnah 84.5%25112.8%382.7%8297
Arlington 72.0%18,58025.8%6,6592.2%56025,799
Ashburnham 50.5%1,62147.6%1,5291.9%623,212
Ashby 45.2%82752.5%9612.3%421,830
Ashfield 79.6%89216.7%1873.7%421,121
Ashland 58.2%4,95440.0%3,4071.8%1518,512
Athol 53.6%2,52543.9%2,0702.5%1174,712
Attleboro 54.2%10,36943.9%8,4061.8%35319,128
Auburn 51.2%4,49546.9%4,1161.9%1678,778
Avon 51.0%1,22147.2%1,1311.8%422,394
Ayer 55.5%2,02342.7%1,5571.8%643,644
Barnstable 50.5%12,84248.3%12,2901.2%30525,437
Barre 50.1%1,34347.7%1,2792.3%612,683
Becket 70.7%68426.8%2592.5%24967
Bedford 58.2%4,43639.9%3,0461.9%1467,628
Belchertown 59.9%4,54238.0%2,8862.1%1597,587
Bellingham 50.0%4,25648.4%4,1191.6%1408,515
Belmont 64.7%9,10833.6%4,7281.7%24114,077
Berkley 47.6%1,56951.1%1,6861.3%423,297
Berlin 50.9%91746.0%8303.1%561,803
Bernardston 69.4%80928.2%3292.4%281,166
Beverly 58.5%12,07540.2%8,3041.2%25620,635
Billerica 48.9%9,77449.6%9,9251.5%29919,998
Blackstone 51.5%2,22147.0%2,0271.6%674,315
Blandford 45.5%30052.7%3481.8%12660
Bolton 50.5%1,53747.8%1,4571.7%523,046
Boston 78.9%196,09619.4%48,2271.7%4159248,482
Bourne 46.8%4,71952.1%5,2521.1%10610,077
Boxborough 59.3%1,73738.7%1,1341.9%572,928
Boxford 39.8%2,04959.0%3,0321.2%615,142
Boylston 47.9%1,28450.1%1,3412.0%532,678
Braintree 51.5%10,01547.4%9,2171.2%22919,461
Brewster 56.3%3,66942.2%2,7481.5%1006,517
Bridgewater 48.0%5,77450.7%6,0891.3%15712,020
Brimfield 43.9%89753.6%1,0942.5%512,042
Brockton 73.7%25,14025.4%8,6680.9%31034,118
Brookfield 47.8%82249.6%8532.6%451,720
Brookline 77.9%21,76120.5%5,7171.6%45727,935
Buckland 72.5%75024.4%2523.1%321,034
Burlington 52.3%6,97146.5%6,1871.2%16013,318
Cambridge 86.1%41,99110.9%5,3403.0%145648,787
Canton 52.2%6,43046.7%5,7521.1%13712,319
Carlisle 58.5%1,95939.4%1,3182.1%713,348
Carver 47.5%2,87051.4%3,1071.1%696,046
Charlemont 71.4%45626.0%1662.7%17639
Charlton 43.4%2,91054.6%3,6602.0%1366,706
Chatham 49.6%2,28749.4%2,2781.1%494,614
Chelmsford 49.4%9,60649.0%9,5341.6%31919,459
Chelsea 80.7%6,76018.0%1,5101.3%1058,375
Cheshire 69.8%1,21628.3%4931.8%321,741
Chester 50.1%33146.1%3053.8%25661
Chesterfield 63.5%45531.8%2284.6%33716
Chicopee 62.3%14,29235.9%8,2371.7%39422,923
Chilmark 80.5%58517.5%1272.1%15727
Clarksburg 71.5%61327.1%2321.4%12857
Clinton 57.6%3,49240.4%2,4512.0%1216,064
Cohasset 45.8%2,22653.4%2,5950.9%424,863
Colrain 70.1%61826.3%2323.5%31881
Concord 66.4%7,28232.0%3,5091.5%16910,960
Conway 74.1%92623.0%2882.9%361,250
Cummington 69.7%36826.3%1394.0%21528
Dalton 71.8%2,43326.2%8882.0%673,388
Danvers 50.6%7,34448.1%6,9841.2%17914,507
Dartmouth 61.3%9,81737.2%5,9641.5%24316,024
Dedham 56.7%7,71842.0%5,7191.3%17413,611
Deerfield 69.7%2,10327.8%8392.5%763,018
Dennis 52.9%4,89245.9%4,2441.2%1099,245
Dighton 48.0%1,74350.8%1,8421.2%433,628
Douglas 42.0%1,89456.4%2,5421.6%734,509
Dover 42.8%1,53156.1%2,0041.1%393,574
Dracut 45.6%6,92552.9%8,0261.5%22415,175
Dudley 48.7%2,46650.2%2,5441.1%575,067
Dunstable 43.4%81954.7%1,0341.9%361,889
Duxbury 43.9%3,54355.2%4,4500.9%728,065
East Bridgewater 45.8%3,34053.0%3,8671.2%917,298
East Brookfield 40.9%46957.8%6621.3%151,146
Eastham 59.5%2,18739.3%1,4461.2%453,678
Easthampton 69.8%6,28127.4%2,4632.9%2589,002
East Longmeadow 46.9%4,08552.0%4,5231.1%968,704
Easton 47.5%5,69051.4%6,1621.1%13711,989
Edgartown 66.3%1,69932.3%8271.4%362,562
Egremont 80.5%67618.0%1511.5%13840
Erving 72.3%55726.0%2001.7%13770
Essex 53.5%1,15444.6%9621.9%422,158
Everett 71.6%9,39227.3%3,5821.0%13613,110
Fairhaven 60.8%5,01937.3%3,0821.9%1548,255
Fall River 73.7%21,72424.9%7,3231.4%42029,467
Falmouth 56.8%11,01341.9%8,1301.3%26119,404
Fitchburg 59.2%8,50438.8%5,5742.0%28614,364
Florida 65.3%25432.6%1272.1%8389
Foxborough 49.1%4,74549.7%4,7981.2%1209,663
Framingham 66.2%18,34032.3%8,9381.5%42627,704
Franklin 49.4%8,58949.1%8,5491.5%26317,401
Freetown 49.7%2,30148.4%2,2411.9%904,632
Gardner 57.2%4,68740.6%3,3232.2%1828,192
Georgetown 46.2%2,27252.4%2,5771.3%664,915
Gill 72.8%64623.9%2123.3%29887
Gloucester 62.7%9,68035.7%5,5111.5%23615,427
Goshen 64.3%39532.2%1983.4%21614
Gosnold 56.3%4941.4%362.3%287
Grafton 51.4%4,85346.8%4,4271.8%1709,450
Granby 53.4%1,86245.0%1,5701.5%543,486
Granville 42.0%37456.4%5021.6%14890
Great Barrington 81.3%2,91616.6%5952.1%763,587
Greenfield 74.0%6,17522.7%1,8913.3%2748,340
Groton 52.4%3,20145.9%2,8061.7%1066,113
Groveland 45.9%1,82452.4%2,0801.7%663,970
Hadley 69.0%2,11928.9%8862.1%663,071
Halifax 47.3%1,93850.6%2,0712.1%854,094
Hamilton 48.7%2,16349.6%2,2041.8%794,446
Hampden 44.3%1,28654.0%1,5691.7%502,905
Hancock 59.7%22837.2%1423.1%12382
Hanover 40.2%3,34259.0%4,9100.9%718,323
Hanson 45.1%2,51253.9%2,9991.0%575,568
Hardwick 54.2%71042.7%5593.1%401,309
Harvard 60.1%2,16637.8%1,3622.1%753,603
Harwich 54.0%4,37644.5%3,6071.4%1168,099
Hatfield 66.9%1,36231.4%6381.7%352,035
Haverhill 55.7%15,34242.7%11,7581.6%43527,535
Hawley 63.6%12632.8%653.5%7198
Heath 68.5%29229.1%1242.3%10426
Hingham 47.8%6,75051.2%7,2311.0%13514,116
Hinsdale 68.9%72828.1%2973.0%321,057
Holbrook 55.0%3,02443.7%2,4021.3%725,498
Holden 48.1%5,05550.4%5,2941.5%15410,503
Holland 44.8%59352.1%6903.1%411,324
Holliston 55.9%4,62142.4%3,5021.7%1448,267
Holyoke 76.2%12,49222.2%3,6391.6%25716,388
Hopedale 51.7%1,69846.5%1,5271.7%573,282
Hopkinton 48.5%4,19750.1%4,3341.4%1238,654
Hubbardston 44.6%1,16053.1%1,3812.3%592,600
Hudson 56.4%5,64241.8%4,1831.9%18710,012
Hull 58.9%3,57639.8%2,4171.2%756,068
Huntington 50.4%55443.6%4796.0%661,099
Ipswich 53.2%4,41745.1%3,7421.6%1368,295
Kingston 45.6%3,17653.5%3,7240.9%656,965
Lakeville 41.7%2,41157.1%3,3011.2%725,784
Lancaster 46.5%1,72451.6%1,9141.9%723,710
Lanesborough 71.7%1,14426.9%4301.4%221,596
Lawrence 83.3%18,24015.8%3,4590.8%18521,884
Lee 73.8%2,15024.5%7131.7%492,912
Leicester 49.8%2,74448.4%2,6671.7%965,507
Lenox 76.0%2,31822.1%6751.8%563,049
Leominster 52.5%9,76945.9%8,5401.6%29718,606
Leverett 80.9%98715.0%1834.1%501,220
Lexington 69.4%12,67529.0%5,2871.6%29518,257
Leyden 73.4%33924.9%1151.7%8462
Lincoln 69.9%2,55828.8%1,0551.3%473,660
Littleton 54.2%2,91543.8%2,3572.0%1105,382
Longmeadow 56.3%4,85142.5%3,6621.2%1018,614
Lowell 66.9%22,59731.3%10,5861.8%59533,778
Ludlow 54.1%5,23344.4%4,2951.5%1439,671
Lunenburg 46.6%2,74851.5%3,0381.8%1095,895
Lynn 72.2%22,96526.6%8,4631.2%37231,800
Lynnfield 38.2%2,77360.9%4,4190.9%687,260
Malden 71.3%14,94027.3%5,7141.5%31420,968
Manchester 54.3%1,88644.3%1,5391.4%483,473
Mansfield 49.5%5,91049.0%5,8551.5%18311,948
Marblehead 55.2%6,82443.9%5,4221.0%11812,364
Marion 53.5%1,72545.1%1,4561.4%453,226
Marlborough 57.3%9,57641.1%6,8671.6%26316,706
Marshfield 46.7%7,04152.2%7,8661.1%16415,071
Mashpee 49.9%4,13349.0%4,0581.1%898,280
Mattapoisett 51.6%2,04146.9%1,8551.4%573,953
Maynard 62.8%3,63535.0%2,0232.2%1305,788
Medfield 46.5%3,44852.1%3,8641.4%1037,415
Medford 67.9%18,61330.3%8,2941.8%49427,401
Medway 50.0%3,61548.7%3,5191.4%987,232
Melrose 60.2%9,28938.5%5,9361.3%20215,427
Mendon 44.5%1,51754.0%1,8401.4%493,406
Merrimac 51.7%1,84446.5%1,6571.8%653,566
Methuen 51.5%11,04847.4%10,1681.2%25421,470
Middleborough 45.5%5,19252.8%6,0291.7%18911,410
Middlefield 69.4%20226.5%774.1%12291
Middleton 41.4%1,90957.5%2,6511.1%504,610
Milford 55.6%7,12943.0%5,5041.4%18112,814
Millbury 50.3%3,41048.1%3,2621.7%1126,784
Millis 51.1%2,42147.1%2,2321.8%834,736
Millville 46.1%71752.2%8131.7%271,557
Milton 60.1%9,49938.7%6,1221.2%18215,803
Monroe 60.4%3239.6%210.0%053
Monson 50.7%2,17647.4%2,0321.9%834,291
Montague 76.3%3,21320.7%8733.0%1264,212
Monterey 78.8%41718.3%972.8%15529
Montgomery 43.4%22054.0%2742.6%13507
Mount Washington 76.9%8317.6%195.6%6108
Nahant 59.7%1,37139.1%8971.2%272,295
Nantucket 62.8%3,82835.8%2,1851.4%846,097
Natick 62.2%11,60036.2%6,7571.5%28518,642
Needham 60.4%10,20738.5%6,5131.1%18316,903
New Ashford 69.9%10726.1%403.9%6153
New Bedford 75.9%25,20522.7%7,5411.4%47433,220
New Braintree 50.6%28346.0%2573.4%19559
Newbury 51.3%2,27247.4%2,1001.4%604,432
Newburyport 61.6%6,78436.9%4,0591.5%16811,011
New Marlborough 68.4%57228.7%2402.9%24836
New Salem 62.9%38133.8%2053.3%20606
Newton 71.4%32,09927.0%12,1541.6%71044,963
Norfolk 42.5%2,42456.1%3,1991.3%755,698
North Adams 77.5%4,42720.0%1,1442.4%1395,710
Northampton 82.4%13,11013.7%2,1793.9%62615,915
North Andover 46.2%6,99152.8%7,9921.0%14815,131
North Attleborough 46.7%6,60251.8%7,3311.5%21414,147
Northborough 52.3%4,38746.1%3,8721.6%1358,394
Northbridge 44.8%3,40853.5%4,0721.7%1277,607
North Brookfield 44.4%1,05053.7%1,2711.9%462,367
Northfield 68.5%1,11529.1%4732.4%391,627
North Reading 45.6%3,98653.1%4,6411.3%1148,741
Norton 49.2%4,45449.1%4,4491.6%1499,052
Norwell 42.0%2,71457.0%3,6841.0%626,460
Norwood 55.5%8,09843.1%6,2921.4%20614,596
Oak Bluffs 70.3%1,95528.6%7951.1%312,781
Oakham 44.4%50953.1%6092.4%281,146
Orange 56.2%1,81841.0%1,3252.8%923,235
Orleans 55.9%2,49643.0%1,9221.1%494,467
Otis 59.0%48937.5%3113.5%29829
Oxford 48.1%3,12550.2%3,2611.7%1086,494
Palmer 53.6%3,02044.0%2,4822.4%1345,636
Paxton 44.7%1,11954.1%1,3541.2%292,502
Peabody 55.8%15,01043.2%11,6161.0%26426,890
Pelham 82.1%72814.9%1323.0%27887
Pembroke 46.9%4,57452.0%5,0731.1%1129,759
Pepperell 45.3%2,93652.9%3,4261.9%1206,482
Peru 68.4%32428.7%1363.0%14474
Petersham 55.4%45141.5%3383.1%25814
Phillipston 48.8%46449.3%4691.9%18951
Pittsfield 78.0%15,60020.2%4,0441.7%34419,988
Plainfield 74.3%28621.6%834.2%16385
Plainville 47.0%2,06851.6%2,2691.3%594,396
Plymouth 50.8%15,10647.9%14,2581.3%37229,736
Plympton 44.6%77653.4%9282.0%341,738
Princeton 48.3%1,11249.9%1,1481.8%422,302
Provincetown 89.1%2,1218.8%2102.1%492,380
Quincy 61.5%24,71436.9%14,8161.6%62640,156
Randolph 75.6%11,43023.5%3,5500.9%13315,113
Raynham 46.2%3,21752.5%3,6571.3%936,967
Reading 52.2%7,44746.6%6,6401.2%17014,257
Rehoboth 46.5%2,91251.9%3,2461.6%996,257
Revere 65.9%11,14132.9%5,5601.2%19616,897
Richmond 74.5%68824.5%2261.0%9923
Rochester 43.6%1,36254.5%1,7041.9%593,125
Rockland 52.4%4,52646.2%3,9891.4%1258,640
Rockport 62.9%2,98235.2%1,6701.9%924,744
Rowe 58.1%14038.2%923.7%9241
Rowley 44.6%1,59654.0%1,9351.4%513,582
Royalston 57.8%39139.5%2672.7%18676
Russell 49.2%38849.0%3861.8%14788
Rutland 46.3%2,07152.1%2,3291.6%714,471
Salem 69.1%13,42929.0%5,6351.9%37119,435
Salisbury 53.3%2,27845.3%1,9381.4%614,277
Sandisfield 64.6%29433.8%1541.5%7455
Sandwich 46.7%5,80252.2%6,4921.1%13912,433
Saugus 50.9%6,95748.0%6,5571.0%14213,656
Savoy 67.9%24129.0%1033.1%11355
Scituate 48.8%5,52850.0%5,6591.2%13411,321
Seekonk 51.9%3,77246.5%3,3821.6%1157,269
Sharon 63.4%6,55835.4%3,6591.2%12110,338
Sheffield 70.5%1,29127.5%5032.1%381,832
Shelburne 77.0%87319.9%2263.1%351,134
Sherborn 53.9%1,43044.4%1,1791.7%442,653
Shirley 49.6%1,55347.3%1,4823.0%953,130
Shrewsbury 53.6%9,67445.2%8,1541.3%22618,054
Shutesbury 82.2%1,02812.5%1565.3%661,250
Somerset 61.5%6,09137.1%3,6741.4%1429,907
Somerville 82.2%28,46714.1%4,8653.7%129034,622
Southampton 53.3%1,86145.3%1,5841.4%493,494
Southborough 50.6%2,93547.9%2,7821.5%875,804
Southbridge 64.4%4,25634.7%2,2910.9%576,604
South Hadley 61.2%5,36237.1%3,2521.7%1478,761
Southwick 41.8%2,05056.5%2,7701.7%814,901
Spencer 47.3%2,61750.4%2,7852.3%1285,530
Springfield 79.7%42,96319.2%10,3721.1%57353,908
Sterling 42.5%2,02955.9%2,6671.7%794,775
Stockbridge 78.1%94418.7%2263.1%381,208
Stoneham 53.6%6,63445.1%5,5801.2%15412,368
Stoughton 58.5%8,11940.3%5,5911.3%18013,890
Stow 55.2%2,34843.0%1,8311.8%774,256
Sturbridge 47.9%2,51449.9%2,6152.2%1165,245
Sudbury 57.5%6,02641.4%4,3411.1%11510,482
Sunderland 73.2%1,36321.7%4045.1%951,862
Sutton 40.7%2,18157.6%3,0871.7%895,357
Swampscott 59.7%4,89939.0%3,2021.3%1058,206
Swansea 57.2%4,51241.5%3,2691.3%1017,882
Taunton 59.6%13,47938.8%8,7831.6%35822,620
Templeton 49.2%1,85749.0%1,8511.8%693,777
Tewksbury 46.9%7,54051.8%8,3321.3%20916,081
Tisbury 74.2%1,84523.9%5951.8%452,485
Tolland 39.6%11055.8%1554.7%13278
Topsfield 44.9%1,80054.0%2,1641.1%464,010
Townsend 42.4%2,08755.4%2,7252.3%1114,923
Truro 71.0%1,04127.2%3991.8%271,467
Tyngsborough 45.1%2,83753.4%3,3611.5%956,293
Tyringham 67.1%17332.9%850.0%0258
Upton 47.3%1,98550.8%2,1321.9%794,196
Uxbridge 46.3%3,32551.9%3,7281.8%1287,181
Wakefield 51.7%7,48647.0%6,8061.3%18614,478
Wales 51.7%47946.8%4341.5%14927
Walpole 45.5%6,36053.3%7,4561.2%16813,984
Waltham 62.8%15,74835.2%8,8162.0%50225,066
Ware 56.2%2,39042.0%1,7831.8%764,249
Wareham 55.9%6,06942.7%4,6321.4%15510,856
Warren 52.9%1,21943.5%1,0023.6%822,303
Warwick 73.7%33424.1%1092.2%10453
Washington 75.9%23921.9%692.2%7315
Watertown 71.1%11,87827.0%4,5161.9%32216,716
Wayland 62.4%5,15336.0%2,9751.6%1328,260
Webster 51.8%3,47646.4%3,1111.8%1196,706
Wellesley 56.7%8,24342.2%6,1441.1%16214,549
Wellfleet 69.9%1,56827.6%6192.5%552,242
Wendell 76.6%42512.6%7010.8%60555
Wenham 44.8%1,05853.6%1,2651.5%362,359
Westborough 55.8%4,99942.6%3,8181.5%1358,952
West Boylston 48.7%2,02950.0%2,0831.3%554,167
West Bridgewater 43.8%1,73454.8%2,1691.3%523,955
West Brookfield 49.5%96448.8%9501.6%321,946
Westfield 52.0%9,22846.1%8,1781.9%32917,735
Westford 49.5%6,38548.8%6,2951.7%21612,896
Westhampton 60.4%63936.4%3853.2%341,058
Westminster 45.4%1,94052.5%2,2452.1%914,276
West Newbury 50.0%1,38348.7%1,3471.3%372,767
Weston 51.2%3,39047.7%3,1591.1%726,621
Westport 59.1%5,07439.3%3,3721.6%1418,587
West Springfield 53.6%6,17044.9%5,1691.5%17611,515
West Stockbridge 79.8%70718.2%1612.0%18886
West Tisbury 79.5%1,57118.8%3711.7%331,975
Westwood 48.2%4,33750.6%4,5491.2%1068,992
Weymouth 54.4%15,13044.3%12,3411.3%36127,832
Whately 65.2%62631.4%3013.4%33960
Whitman 49.2%3,65449.2%3,6521.6%1177,423
Wilbraham 45.6%3,74552.8%4,3321.6%1288,205
Williamsburg 76.4%1,23920.0%3243.6%591,622
Williamstown 80.9%3,01217.2%6401.9%713,723
Wilmington 47.2%5,89051.5%6,4371.3%16212,489
Winchendon 51.5%2,14246.5%1,9332.0%854,160
Winchester 54.8%7,00043.9%5,6021.3%16512,767
Windsor 73.8%38524.3%1271.9%10522
Winthrop 58.6%5,21140.2%3,5751.2%1098,895
Woburn 53.5%10,29145.2%8,7071.3%24519,243
Worcester 69.0%40,56829.2%17,1551.8%103358,756
Worthington 66.5%48128.8%2084.7%34723
Wrentham 42.7%2,70455.9%3,5351.4%896,328
Yarmouth 51.8%7,18347.0%6,5261.2%16313,872

Results by congressional district

Obama won all 9 congressional districts. [13]

DistrictObamaRomneyRepresentative
1st 63.96%34.27% Richard Neal
2nd 58.7%39.18% Jim McGovern
3rd 56.91%41.41% Niki Tsongas
4th 57.24%41.29% Joseph Kennedy III
5th 65.19%33.13% Ed Markey
6th 54.74%43.89% John F. Tierney
7th 82.46%15.64% Mike Capuano
8th 57.78%40.85% Stephen Lynch
9th 55.54%43.14% William R. Keating

See also

Notes

    Related Research Articles

    <span class="mw-page-title-main">2008 United States presidential election in Massachusetts</span> Election in Massachusetts

    The 2008 United States presidential election in Massachusetts took place, as in all 50 states and D.C., as part of the 2008 United States presidential election of November 4, 2008. Voters chose 12 representatives, or electors to the Electoral College, who, in turn, voted for the office of president and vice president.

    <span class="mw-page-title-main">2012 United States presidential election in Colorado</span> Election in Colorado

    The 2012 United States presidential election in Colorado took place on November 6, 2012, as part of the 2012 United States presidential election in which all 50 states plus the District of Columbia participated. Colorado voters chose nine electors to represent them in the Electoral College via a popular vote pitting incumbent Democratic President Barack Obama and his running mate, Vice President Joe Biden, against Republican challenger and former Massachusetts Governor Mitt Romney and his running mate, Congressman Paul Ryan. Obama and Biden carried Colorado with 51.45% of the popular vote to Romney's and Ryan's 46.09%, thus winning the state's nine electoral votes by a 5.36% margin.
    <span class="mw-page-title-main">2012 United States presidential election in Washington (state)</span> Election in Washington

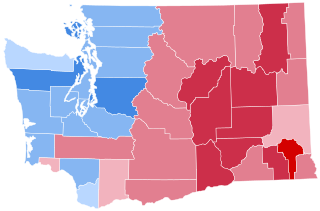
    The 2012 United States presidential election in Washington took place on November 6, 2012, as part of the 2012 United States presidential election in which all 50 states plus the District of Columbia participated. Washington voters chose 12 electors to represent them in the Electoral College via a popular vote pitting incumbent Democratic President Barack Obama and his running mate, Vice President Joe Biden, against Republican challenger and former Massachusetts Governor Mitt Romney and his running mate, Congressman Paul Ryan.
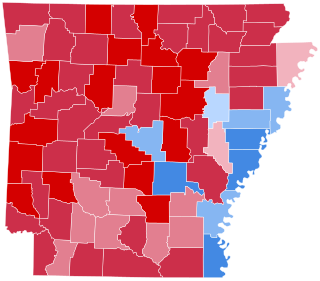
    <span class="mw-page-title-main">2012 United States presidential election in Arkansas</span>

    The 2012 United States presidential election in Arkansas took place on November 6, 2012, as part of the 2012 General Election in which all 50 states plus the District of Columbia participated. Arkansas voters chose six electors to represent them in the Electoral College via a popular vote pitting incumbent Democratic President Barack Obama and his running mate, Vice President Joe Biden, against Republican challenger and former Massachusetts Governor Mitt Romney and his running mate, Congressman Paul Ryan.

    <span class="mw-page-title-main">2012 United States presidential election in Connecticut</span> Election in Connecticut

    The 2012 United States presidential election in Connecticut took place on November 6, 2012, as part of the 2012 United States presidential election in which all 50 states plus the District of Columbia participated. Connecticut voters chose seven electors to represent them in the Electoral College via a popular vote pitting incumbent Democratic President Barack Obama and his running mate, Vice President Joe Biden, against Republican challenger and former Massachusetts Governor Mitt Romney and his running mate, Congressman Paul Ryan. Obama and Biden carried Connecticut with 58.1% of the popular vote to Romney's and Ryan's 40.7%, thus winning the state's seven electoral votes. Romney managed to flip the traditionally Republican Litchfield County, which Obama had won in 2008. As of the 2020 United States presidential election, this was the last election that the Democratic presidential nominee won Windham County.

    <span class="mw-page-title-main">2012 United States presidential election in Georgia</span> Election in Georgia

    The 2012 United States presidential election in Georgia took place on November 6, 2012, as part of the 2012 General Election in which all 50 states plus the District of Columbia participated. Georgia voters chose 16 electors to represent them in the Electoral College via a popular vote pitting incumbent Democratic President Barack Obama and his running mate, Vice President Joe Biden, against Republican challenger and former Massachusetts Governor Mitt Romney and his running mate, Congressman Paul Ryan.

    <span class="mw-page-title-main">2012 United States presidential election in Kentucky</span> Election in Kentucky

    The 2012 United States presidential election in Kentucky took place on November 6, 2012, as part of the 2012 General Election in which all 50 states plus the District of Columbia participated. Kentucky voters chose eight electors to represent them in the Electoral College via a popular vote pitting incumbent Democratic President Barack Obama and his running mate, Vice President Joe Biden, against Republican challenger and former Massachusetts Governor Mitt Romney and his running mate, Congressman Paul Ryan.

    <span class="mw-page-title-main">2012 United States presidential election in Mississippi</span> Election in Mississippi

    The 2012 United States presidential election in Mississippi took place on November 6, 2012, as part of the 2012 general election in which all 50 states plus the District of Columbia participated. Mississippi voters chose six electors to represent them in the Electoral College via a popular vote pitting incumbent Democratic President Barack Obama and his running mate, Vice President Joe Biden, against Republican challenger and former Massachusetts Governor Mitt Romney and his running mate, Congressman Paul Ryan.

    <span class="mw-page-title-main">2012 United States presidential election in New Mexico</span> Election in New Mexico

    The 2012 United States presidential election in New Mexico took place on November 6, 2012, as part of the 2012 United States presidential election in which all 50 states plus the District of Columbia participated. This was the 25th U.S. presidential election in which New Mexico participated. New Mexico voters chose five electors to represent them in the Electoral College via a popular vote pitting incumbent Democratic President Barack Obama and his running mate, Vice President Joe Biden, against Republican challenger and former Massachusetts Governor Mitt Romney and his running mate, Congressman Paul Ryan.

    <span class="mw-page-title-main">2012 United States presidential election in Idaho</span> Election in Idaho

    The 2012 United States presidential election in Idaho took place on November 6, 2012, as part of the 2012 United States presidential election in which all 50 states plus the District of Columbia participated. Idaho voters chose four electors to represent them in the Electoral College via a popular vote pitting incumbent Democratic President Barack Obama and his running mate, Vice President Joe Biden, against Republican challenger and former Massachusetts Governor Mitt Romney and his running mate, Congressman Paul Ryan. Prior to the election, 17 news organizations considered this a state Romney would win, or otherwise considered as a safe red state. Romney and Ryan carried Idaho with 64.09% of the popular vote to Obama's and Biden's 32.40%, thus winning the state's four electoral votes. Romney's victory in Idaho made it his fourth strongest state in the 2012 election after Utah, Wyoming and Oklahoma. He improved on McCain's performance in 2008, expanding his margin from 25.3% to 31.69% and flipping Teton County which had previously voted for Obama.

    <span class="mw-page-title-main">2012 United States presidential election in North Carolina</span>

    The 2012 United States presidential election in North Carolina took place on November 6, 2012, as part of the 2012 general election in which all 50 states plus the District of Columbia participated. North Carolina voters chose 15 electors to represent them in the Electoral College via a popular vote pitting incumbent Democratic President Barack Obama and his running mate, Vice President Joe Biden, against Republican challenger and former Massachusetts Governor Mitt Romney and his running mate, Congressman Paul Ryan.

    <span class="mw-page-title-main">2012 United States presidential election in Tennessee</span> Election in Tennessee

    The 2012 United States presidential election in Tennessee took place on November 6, 2012, as part of the 2012 United States presidential election in which all 50 states plus the District of Columbia participated. Tennessee voters chose 11 electors to represent them in the Electoral College via a popular vote pitting incumbent Democratic President Barack Obama and his running mate, Vice President Joe Biden, against Republican challenger and former Massachusetts Governor Mitt Romney and his running mate, Congressman Paul Ryan.

    <span class="mw-page-title-main">2012 United States presidential election in Texas</span> Election in Texas

    The 2012 United States presidential election in Texas took place on November 6, 2012, as part of the 2012 United States presidential election in which all 50 states plus the District of Columbia participated. Texas voters chose 38 electors to represent them in the Electoral College via a popular vote pitting incumbent Democratic President Barack Obama and his running mate, Vice President Joe Biden, against Republican challenger and former Massachusetts Governor Mitt Romney and his running mate, Congressman Paul Ryan.

    <span class="mw-page-title-main">2012 United States presidential election in Vermont</span>

    The 2012 United States presidential election in Vermont took place on November 6, 2012, as part of the 2012 United States presidential election in which all 50 states plus the District of Columbia participated. Vermont voters chose three electors to represent them in the Electoral College via a popular vote pitting incumbent Democratic President Barack Obama and his running mate, Vice President Joe Biden, against Republican challenger and former Massachusetts Governor Mitt Romney and his running mate, Congressman Paul Ryan.

    <span class="mw-page-title-main">2012 United States presidential election in Utah</span> Election in Utah

    The 2012 United States presidential election in Utah took place on November 6, 2012, as part of the 2012 United States presidential election in which all 50 states plus the District of Columbia participated. Utah voters chose six electors to represent them in the Electoral College via a popular vote pitting incumbent Democratic President Barack Obama and his running mate, Vice President Joe Biden, against Republican challenger and former Massachusetts Governor Mitt Romney and his running mate, Congressman Paul Ryan.

    <span class="mw-page-title-main">2012 United States presidential election in Kansas</span> Election in Kansas

    The 2012 United States presidential election in Kansas took place on November 6, 2012, as part of the 2012 United States presidential election in which all 50 states plus the District of Columbia participated. Kansas voters chose six electors to represent them in the Electoral College via a popular vote pitting incumbent Democratic President Barack Obama and his running mate, Vice President Joe Biden, against Republican challenger and former Massachusetts Governor Mitt Romney and his running mate, Congressman Paul Ryan. Romney and Ryan carried the state with 59.59 percent of the popular vote to Obama's and Biden's 38.00 percent, thus winning the state's six electoral votes.

    <span class="mw-page-title-main">2012 United States presidential election in Wisconsin</span>

    The 2012 United States presidential election in Wisconsin took place on November 6, 2012, as part of the 2012 United States presidential election in which all 50 states plus the District of Columbia participated. Wisconsin voters chose 10 electors to represent them in the Electoral College via a popular vote pitting incumbent Democratic President Barack Obama and his running mate, Vice President Joe Biden, against Republican challenger and former Massachusetts Governor Mitt Romney and his running mate, Congressman Paul Ryan.
    <span class="mw-page-title-main">2012 United States presidential election in Nebraska</span> Election in nebraska

    The 2012 United States presidential election in Nebraska took place on November 6, 2012, as part of the 2012 United States presidential election in which all 50 states plus the District of Columbia participated. Voters chose five electors to represent them in the Electoral College via a popular vote pitting incumbent Democratic President Barack Obama and his running mate, Vice President Joe Biden, against Republican challenger and former Massachusetts Governor Mitt Romney and his running mate, Congressman Paul Ryan.

    <span class="mw-page-title-main">2012 United States presidential election in Alabama</span> Election in Alabama

    The 2012 United States presidential election in Alabama took place on November 6, 2012, as part of the 2012 general election, in which all 50 states plus the District of Columbia participated. Alabama voters chose nine electors to represent them in the Electoral College via a popular vote pitting incumbent Democratic President Barack Obama and his running mate, Vice President Joe Biden, against Republican challenger and former Massachusetts Governor Mitt Romney and his running mate, Congressman Paul Ryan.
    <span class="mw-page-title-main">2012 United States presidential election in Alaska</span> Election in Alaska

    The 2012 United States presidential election in Alaska took place on November 6, 2012, as part of the 2012 United States presidential election in which all 50 states plus the District of Columbia participated. Alaska voters chose three electors to represent them in the Electoral College via a popular vote pitting incumbent Democratic President Barack Obama and his running mate, Vice President Joe Biden, against Republican challenger and former Massachusetts Governor Mitt Romney and his running mate, Congressman Paul Ryan.

    References

    1. "2012 Presidential Election – Massachusetts". Politico. Retrieved November 22, 2012.
    2. 1 2 "PD43+ » 2012 President Democratic Primary". PD43+. Secretary of the Commonwealth of Massachusetts. Retrieved March 6, 2020.
    3. 1 2 3 "Massachusetts Democratic Delegation 2012". www.thegreenpapers.com. The Green Papers. Retrieved March 6, 2020.
    4. "Primary and Caucus Printable Calendar". CNN . Retrieved January 11, 2012.
    5. "Presidential Primary Dates" (PDF). Federal Election Commission . Retrieved January 23, 2012.
    6. Nate Silver (March 4, 2012). "Romney Could Win Majority of Super Tuesday Delegates". FiveThirtyEight . Retrieved March 5, 2012.
    7. Boston Globe (March 4, 2012). "2012 Massachusetts Republican Presidential Primary results". Boston Globe . Retrieved April 11, 2012.
    8. "Archived copy" (PDF). Archived from the original (PDF) on August 22, 2012. Retrieved March 30, 2012.{{cite web}}: CS1 maint: archived copy as title (link)
    9. Massachusetts – CNN
    10. "Massachusetts – Fox News". Fox News . Archived from the original on April 7, 2012. Retrieved March 30, 2012.
    11. "PD43+ » 2012 President Green-Rainbow Primary". PD43+. Secretary of the Commonwealth of Massachusetts. Retrieved March 6, 2020.
    12. "Massachusetts Secretary of State" . Retrieved November 30, 2012.
    13. "Daily Kos Elections' statewide election results by congressional and legislative districts". Daily Kos. Retrieved August 11, 2020.