Climate of California

Last updated

Koppen climate types of California, using 1991-2020 climate normals. Koppen Climate Types California.png
Köppen climate types of California, using 1991–2020 climate normals.
Golden Gate Bridge in fog GGB in fog 2007 edit.jpg
Golden Gate Bridge in fog
Snow in the mountains of Southern California Snow on the mountains of Southern California.jpg
Snow in the mountains of Southern California
Summer in the Sierra Nevada at Lake Tahoe EmeraldBay LakeTahoe.jpg
Summer in the Sierra Nevada at Lake Tahoe
High precipitation in 2005 caused an ephemeral lake in the Badwater Basin of Death Valley. LakeBadwater.JPG
High precipitation in 2005 caused an ephemeral lake in the Badwater Basin of Death Valley.

The climate of California varies widely from hot desert to alpine tundra, depending on latitude, elevation, and proximity to the Pacific Coast. California's coastal regions, the Sierra Nevada foothills, and much of the Central Valley have a Mediterranean climate, with warmer, drier weather in summer and cooler, wetter weather in winter. The influence of the ocean generally moderates temperature extremes, creating warmer winters and substantially cooler summers in coastal areas.

Contents

Temperature range

Snow on the ground in San Bernardino, Shandin Hills visible in the background Sbsnow 2.jpg
Snow on the ground in San Bernardino, Shandin Hills visible in the background

The cool offshore, enhanced by upwelling of cold sub-surface waters, often creates summer fog near the coast, creating a warm-summer Mediterranean climate (Köppen climate classification Csb). Farther inland, the climate becomes more continental, with some areas turning semi-arid (Köppen BSk), with colder winters and markedly hotter summers. Low-lying inland valleys, especially the Central Valley, have a hot-summer Mediterranean climate (Köppen Csa), with subtropical temperatures but a well-defined sunny summer season and a foggy winter season.

The temperature gradient between immediate coast and low-lying inland valleys in the south is about 7 °F (4 °C) in winter, the coast being warmer, and in summer roughly 20 °F (11 °C), the interior being warmer. For example, the average daily high in San Francisco in July and August is between 62 and 68 °F (17 and 20 °C), [1] [2] and in Walnut Creek, some 20 miles (32 km) inland, the average daily high in July and August is 84 °F (29 °C): a temperature gain of more than one degree (Fahrenheit) per mile. [3] In Southern California, the temperature differences are approximately 4 °F in winter and 23 °F (2 °C and 13 °C) in summer. At the coast in Santa Monica, the average high in August is 75 °F (24 °C), while in Burbank, approximately 10 miles (16 km) inland, the average high in August is 95 °F (35 °C): a temperature gain of about two degrees Fahrenheit per mile. [4]

During the cooler winter months (October–March), the Coachella Valley regularly has the warmest winter temperatures out of any place west of the Rocky Mountains. East Los Angeles, the Gateway Cities, and parts of the San Gabriel Valley average the warmest winter high temps (72 °F, 22 °C) in all of the western U.S., and Santa Monica averages the warmest winter lows (52 °F, 11 °C) in all of the western U.S. Palm Springs, a city in the Coachella Valley, averages high/low/mean temperatures of 75 °F/50 °F/63 °F, (24 °C/10 °C/17 °C) respectively during the period of cooler weather from November to April. [5]

The extreme southwest, around San Diego, has a subtropical semi-arid or steppe climate (Koppen BSh) as winters are drier there.

The southeastern regions have a hot arid climate (Koppen BWh), similar to that of the Sahara Desert. In the northern portion of the Mojave Desert on the east side of the state is Death Valley, which has recorded temperatures among the highest in the world. It is common in the summer for temperatures in the valley to surpass 120 °F (49 °C). The highest reliably recorded temperature in the world, [6] [7] 134 °F (56.7 °C), was recorded in Death Valley on July 10, 1913. Temperatures of 130 °F (54 °C) or higher have been recorded as recently as 2005. The 24-hour average July temperature in Death Valley is 101.8 °F (38.8 °C) (1981–2010 NCDC Normals).

Average daily high and low temperatures in °F (°C)
for locations in California,
colored and sortable by average monthly temperature
PlaceJanFebMarAprMayJunJulAugSepOctNovDec
Alturas [8] 44/18
(7/−8)
48/21
(9/−6)
54/25
(12/−4)
60/28
(16/−2)
70/34
(21/1)
79/40
(26/4)
90/44
(32/7)
89/42
(32/6)
80/36
(27/2)
68/28
(20/−2)
52/23
(11/−5)
42/18
(6/−8)
Bakersfield [9] 56/39
(13/4)
63/42
(17/6)
69/47
(21/8)
75/50
(24/10)
84/58
(29/14)
91/64
(33/18)
97/71
(36/22)
96/69
(36/21)
90/64
(32/18)
80/55
(27/13)
66/45
(19/7)
57/39
(14/4)
Bishop [10] 54/23
(12/−5)
58/27
(14/−3)
66/31
(19/−1)
73/36
(23/2)
82/44
(28/7)
92/51
(33/11)
98/56
(37/13)
96/54
(36/12)
88/47
(31/8)
76/37
(24/3)
63/28
(17/−2)
53/22
(12/−6)
Bodie [11] 40/5
(4/−15)
41/7
(5/−14)
45/11
(7/−12)
50/17
(10/−8)
61/24
(16/−4)
70/30
(21/−1)
78/34
(26/1)
77/32
(25/0)
71/26
(22/−3)
60/18
(16/−8)
49/11
(9/−12)
41/6
(5/−14)
Death Valley [12] 67/40
(19/4)
73/46
(23/8)
82/55
(28/13)
91/62
(33/17)
101/73
(38/23)
110/81
(43/27)
117/88
(47/31)
115/86
(46/30)
107/76
(42/24)
93/62
(34/17)
77/48
(25/9)
65/38
(18/3)
Eureka [13] 56/41
(13/5)
56/42
(13/6)
57/43
(14/6)
58/44
(14/7)
60/48
(16/9)
62/50
(17/10)
63/52
(17/11)
64/53
(18/12)
64/50
(18/10)
62/47
(17/8)
58/44
(14/7)
55/41
(13/5)
Fresno [14] 55/38
(13/3)
62/42
(17/6)
68/46
(20/8)
75/49
(24/9)
84/56
(29/13)
92/62
(33/17)
98/68
(37/20)
97/66
(36/19)
91/62
(33/17)
80/53
(27/12)
65/43
(18/6)
55/38
(13/3)
Los Angeles [15] 68/48
(20/9)
69/49
(21/9)
70/51
(21/11)
73/54
(23/12)
75/57
(24/14)
78/60
(26/16)
83/64
(28/18)
84/64
(29/18)
83/63
(28/17)
79/59
(26/15)
73/52
(23/11)
68/48
(20/9)
Needles [16] 65/44
(18/7)
70/47
(21/8)
77/52
(25/11)
85/59
(29/15)
95/68
(35/20)
104/77
(40/25)
109/84
(43/29)
107/83
(42/28)
100/75
(38/24)
88/62
(31/17)
73/50
(23/10)
63/43
(17/6)
Redding [17] 55/37
(13/3)
60/39
(16/4)
65/43
(18/6)
71/46
(22/8)
81/54
(27/12)
90/61
(32/16)
98/66
(37/19)
97/63
(36/17)
90/58
(32/14)
78/50
(26/10)
63/41
(17/5)
55/36
(13/2)
Riverside [18] 69/43
(21/6)
70/45
(21/7)
73/46
(23/8)
78/50
(26/10)
83/55
(28/13)
89/60
(32/16)
95/64
(35/18)
96/65
(36/18)
92/61
(33/16)
83/55
(28/13)
75/47
(24/8)
68/42
(20/6)
Sacramento [19] 54/39
(12/4)
60/41
(16/5)
65/44
(18/7)
71/46
(22/8)
80/51
(27/11)
87/56
(31/13)
92/58
(33/14)
91/58
(33/14)
87/56
(31/13)
78/50
(26/10)
64/43
(18/6)
54/38
(12/3)
San Diego [20] 65/49
(18/9)
65/51
(18/11)
67/53
(19/12)
68/56
(20/13)
69/59
(21/15)
71/62
(22/17)
75/65
(24/18)
76/67
(24/19)
76/65
(24/18)
73/61
(23/16)
69/54
(21/12)
65/48
(18/9)
San
Francisco
[1]
57/46
(14/8)
60/48
(16/9)
62/49
(17/9)
63/49
(17/9)
64/51
(18/11)
66/53
(19/12)
66/54
(19/12)
68/55
(20/13)
70/55
(21/13)
69/54
(21/12)
63/50
(17/10)
57/46
(14/8)
San Jose [21] 58/42
(14/6)
62/45
(17/7)
66/47
(19/8)
69/49
(21/9)
74/52
(23/11)
79/56
(26/13)
82/58
(28/14)
82/58
(28/14)
80/57
(27/14)
74/53
(23/12)
64/46
(18/8)
58/42
(14/6)
Santa Rosa [22] 59/39
(15/4)
63/41
(17/5)
67/43
(19/6)
70/45
(21/7)
75/48
(24/9)
80/52
(27/11)
82/52
(28/11)
83/53
(28/12)
83/52
(28/11)
78/48
(26/9)
67/43
(19/6)
59/39
(15/4)
South Lake
Tahoe
[23]
43/16
(6/−9)
44/18
(7/−8)
49/23
(9/−5)
54/27
(12/−3)
64/32
(18/0)
72/37
(22/3)
81/41
(27/5)
80/40
(27/4)
74/35
(23/2)
63/28
(17/−2)
51/22
(11/−6)
43/17
(6/−8)

Statewide records

The highest temperature ever recorded in California was 134 °F (57 °C) in Death Valley on July 10, 1913. This is also the highest temperature ever recorded on Earth. The lowest was −45 °F (−43 °C) in Boca on January 20, 1937.

Climate data for California
MonthJanFebMarAprMayJunJulAugSepOctNovDecYear
Record high °F (°C)97
(36)
100
(38)
107
(42)
118
(48)
122
(50)
129
(54)
134
(57)
130
(54)
126
(52)
117
(47)
105
(41)
100
(38)
134
(57)
Record low °F (°C)−45
(−43)
−43
(−42)
−35
(−37)
−30
(−34)
−15
(−26)
2
(−17)
12
(−11)
12
(−11)
−5
(−21)
−20
(−29)
−28
(−33)
−40
(−40)
−45
(−43)
Source: https://www.infoplease.com/science-health/weather/california-temperature-extremes

Full statistics for selected cities

Climate data for Fresno, California (Fresno Airport), 1991–2020 normals, [lower-alpha 1] extremes 1881–present [lower-alpha 2]
MonthJanFebMarAprMayJunJulAugSepOctNovDecYear
Record high °F (°C)78
(26)
84
(29)
91
(33)
101
(38)
110
(43)
112
(44)
115
(46)
113
(45)
114
(46)
102
(39)
90
(32)
77
(25)
115
(46)
Mean maximum °F (°C)68.1
(20.1)
73.7
(23.2)
81.9
(27.7)
90.8
(32.7)
99.0
(37.2)
105.9
(41.1)
107.7
(42.1)
107.1
(41.7)
103.1
(39.5)
93.2
(34.0)
79.6
(26.4)
67.4
(19.7)
109.2
(42.9)
Mean daily maximum °F (°C)55.4
(13.0)
61.3
(16.3)
67.5
(19.7)
73.7
(23.2)
82.7
(28.2)
91.4
(33.0)
97.7
(36.5)
96.5
(35.8)
90.7
(32.6)
78.7
(25.9)
64.9
(18.3)
55.3
(12.9)
76.3
(24.6)
Daily mean °F (°C)48.0
(8.9)
52.3
(11.3)
57.4
(14.1)
62.3
(16.8)
70.2
(21.2)
77.6
(25.3)
83.5
(28.6)
82.2
(27.9)
77.1
(25.1)
66.7
(19.3)
55.1
(12.8)
47.5
(8.6)
65.0
(18.3)
Mean daily minimum °F (°C)40.6
(4.8)
43.3
(6.3)
47.3
(8.5)
50.9
(10.5)
57.6
(14.2)
63.9
(17.7)
69.3
(20.7)
67.9
(19.9)
63.4
(17.4)
54.6
(12.6)
45.4
(7.4)
39.8
(4.3)
53.7
(12.1)
Mean minimum °F (°C)30.5
(−0.8)
33.4
(0.8)
37.2
(2.9)
40.4
(4.7)
47.7
(8.7)
52.9
(11.6)
60.1
(15.6)
59.7
(15.4)
53.8
(12.1)
44.6
(7.0)
34.7
(1.5)
30.2
(−1.0)
28.8
(−1.8)
Record low °F (°C)17
(−8)
24
(−4)
26
(−3)
32
(0)
36
(2)
42
(6)
50
(10)
49
(9)
37
(3)
27
(−3)
26
(−3)
18
(−8)
17
(−8)
Average precipitation inches (mm)2.16
(55)
1.93
(49)
1.90
(48)
1.04
(26)
0.42
(11)
0.24
(6.1)
0.03
(0.76)
0.00
(0.00)
0.05
(1.3)
0.56
(14)
0.87
(22)
1.79
(45)
10.99
(279)
Average precipitation days (≥ 0.01 in)7.78.57.24.52.70.70.30.10.62.24.77.346.5
Average relative humidity (%)83.377.268.957.447.341.939.244.750.058.574.184.260.6
Average dew point °F (°C)39.4
(4.1)
42.4
(5.8)
43.2
(6.2)
43.2
(6.2)
45.3
(7.4)
48.9
(9.4)
52.3
(11.3)
54.1
(12.3)
51.6
(10.9)
47.3
(8.5)
43.2
(6.2)
39.6
(4.2)
45.9
(7.7)
Mean monthly sunshine hours 141.5196.9286.2335.5398.9412.2428.2399.6345.9302.3189.9127.13,564.2
Percent possible sunshine 46657785919496959387624280
Source: NOAA (relative humidity, dew points and sun 1961–1990) [24] [25] [26]
MonthJanFebMarAprMayJunJulAugSepOctNovDecYear
Record high °F (°C)95
(35)
95
(35)
99
(37)
106
(41)
103
(39)
112
(44)
109
(43)
106
(41)
113
(45)
108
(42)
100
(38)
92
(33)
113
(45)
Mean maximum °F (°C)83.0
(28.3)
82.8
(28.2)
85.8
(29.9)
90.1
(32.3)
88.9
(31.6)
89.1
(31.7)
93.5
(34.2)
95.2
(35.1)
99.4
(37.4)
95.7
(35.4)
88.9
(31.6)
81.0
(27.2)
101.5
(38.6)
Mean daily maximum °F (°C)68.0
(20.0)
68.0
(20.0)
69.9
(21.1)
72.4
(22.4)
73.7
(23.2)
77.2
(25.1)
82.0
(27.8)
84.0
(28.9)
83.0
(28.3)
78.6
(25.9)
72.9
(22.7)
67.4
(19.7)
74.8
(23.8)
Daily mean °F (°C)58.4
(14.7)
59.0
(15.0)
61.1
(16.2)
63.6
(17.6)
65.9
(18.8)
69.3
(20.7)
73.3
(22.9)
74.7
(23.7)
73.6
(23.1)
69.3
(20.7)
63.0
(17.2)
57.8
(14.3)
65.8
(18.8)
Mean daily minimum °F (°C)48.9
(9.4)
50.0
(10.0)
52.4
(11.3)
54.8
(12.7)
58.1
(14.5)
61.4
(16.3)
64.7
(18.2)
65.4
(18.6)
64.2
(17.9)
59.9
(15.5)
53.1
(11.7)
48.2
(9.0)
56.8
(13.8)
Mean minimum °F (°C)41.4
(5.2)
42.9
(6.1)
45.4
(7.4)
48.9
(9.4)
53.5
(11.9)
57.4
(14.1)
61.1
(16.2)
61.7
(16.5)
59.1
(15.1)
53.7
(12.1)
45.4
(7.4)
40.5
(4.7)
39.2
(4.0)
Record low °F (°C)28
(−2)
28
(−2)
31
(−1)
36
(2)
40
(4)
46
(8)
49
(9)
49
(9)
44
(7)
40
(4)
34
(1)
30
(−1)
28
(−2)
Average rainfall inches (mm)3.29
(84)
3.64
(92)
2.23
(57)
0.69
(18)
0.32
(8.1)
0.09
(2.3)
0.02
(0.51)
0.00
(0.00)
0.13
(3.3)
0.58
(15)
0.78
(20)
2.48
(63)
14.25
(362)
Average rainy days (≥ 0.01 in)6.16.35.12.81.90.50.40.10.42.22.85.534.1
Mean monthly sunshine hours 225.3222.5267.0303.5276.2275.8364.1349.5278.5255.1217.3219.43,254.2
Percent possible sunshine 71727278646483847573707173
Average ultraviolet index 2.94.26.28.19.210.410.810.08.15.43.52.66.7
Source 1: NOAA (sun 1961–1977) [27] [28] [29] [30]
Source 2: UV Index Today (1995 to 2022) [31]
MonthJanFebMarAprMayJunJulAugSepOctNovDecYear
Record high °F (°C)91
(33)
92
(33)
95
(35)
102
(39)
97
(36)
104
(40)
97
(36)
98
(37)
110
(43)
106
(41)
101
(38)
94
(34)
110
(43)
Mean maximum °F (°C)81.2
(27.3)
80.1
(26.7)
80.6
(27.0)
83.1
(28.4)
80.6
(27.0)
79.8
(26.6)
83.7
(28.7)
86.0
(30.0)
90.7
(32.6)
90.9
(32.7)
87.2
(30.7)
78.8
(26.0)
95.5
(35.3)
Mean daily maximum °F (°C)66.3
(19.1)
65.6
(18.7)
66.1
(18.9)
68.1
(20.1)
69.5
(20.8)
72.0
(22.2)
75.1
(23.9)
76.7
(24.8)
76.5
(24.7)
74.4
(23.6)
70.9
(21.6)
66.1
(18.9)
70.6
(21.4)
Daily mean °F (°C)57.9
(14.4)
57.9
(14.4)
59.1
(15.1)
61.1
(16.2)
63.6
(17.6)
66.4
(19.1)
69.6
(20.9)
70.7
(21.5)
70.1
(21.2)
67.1
(19.5)
62.3
(16.8)
57.6
(14.2)
63.6
(17.6)
Mean daily minimum °F (°C)49.4
(9.7)
50.1
(10.1)
52.2
(11.2)
54.2
(12.3)
57.6
(14.2)
60.9
(16.1)
64.0
(17.8)
64.8
(18.2)
63.7
(17.6)
59.8
(15.4)
53.7
(12.1)
49.1
(9.5)
56.6
(13.7)
Mean minimum °F (°C)41.8
(5.4)
42.9
(6.1)
45.3
(7.4)
48.0
(8.9)
52.7
(11.5)
56.7
(13.7)
60.2
(15.7)
61.0
(16.1)
58.7
(14.8)
53.2
(11.8)
46.1
(7.8)
41.1
(5.1)
39.4
(4.1)
Record low °F (°C)27
(−3)
34
(1)
35
(2)
42
(6)
45
(7)
48
(9)
52
(11)
51
(11)
47
(8)
43
(6)
38
(3)
32
(0)
27
(−3)
Average rainfall inches (mm)2.86
(73)
2.99
(76)
1.73
(44)
0.60
(15)
0.28
(7.1)
0.08
(2.0)
0.04
(1.0)
0.00
(0.00)
0.11
(2.8)
0.49
(12)
0.82
(21)
2.23
(57)
12.23
(311)
Average rainy days (≥ 0.01 in)6.16.35.62.61.70.50.50.10.52.03.25.434.5
Average relative humidity (%)63.467.970.571.074.075.976.676.674.270.565.562.970.8
Average dew point °F (°C)41.4
(5.2)
44.4
(6.9)
46.6
(8.1)
49.1
(9.5)
52.7
(11.5)
56.5
(13.6)
60.1
(15.6)
61.2
(16.2)
59.2
(15.1)
54.1
(12.3)
46.8
(8.2)
41.4
(5.2)
51.1
(10.6)
Source: NOAA (relative humidity and dew point 1961–1990) [27] [32] [33] [34]
Climate data for Sacramento, California (Sacramento Executive Airport), 1991–2020 normals, extremes 1941–present [lower-alpha 3]
MonthJanFebMarAprMayJunJulAugSepOctNovDecYear
Record high °F (°C)76
(24)
78
(26)
88
(31)
95
(35)
105
(41)
115
(46)
114
(46)
112
(44)
114
(46)
104
(40)
87
(31)
74
(23)
115
(46)
Mean maximum °F (°C)65.2
(18.4)
71.1
(21.7)
78.1
(25.6)
87.4
(30.8)
95.3
(35.2)
103.1
(39.5)
105.3
(40.7)
104.1
(40.1)
100.6
(38.1)
91.8
(33.2)
76.5
(24.7)
65.1
(18.4)
107.0
(41.7)
Mean daily maximum °F (°C)56.0
(13.3)
61.3
(16.3)
66.3
(19.1)
72.1
(22.3)
80.3
(26.8)
87.9
(31.1)
92.6
(33.7)
91.9
(33.3)
88.5
(31.4)
78.8
(26.0)
65.0
(18.3)
56.0
(13.3)
74.7
(23.7)
Daily mean °F (°C)47.6
(8.7)
51.4
(10.8)
55.4
(13.0)
59.5
(15.3)
66.1
(18.9)
72.2
(22.3)
75.9
(24.4)
75.3
(24.1)
72.5
(22.5)
64.5
(18.1)
53.9
(12.2)
47.3
(8.5)
61.8
(16.6)
Mean daily minimum °F (°C)39.2
(4.0)
41.5
(5.3)
44.5
(6.9)
47.0
(8.3)
52.0
(11.1)
56.5
(13.6)
59.2
(15.1)
58.8
(14.9)
56.5
(13.6)
50.3
(10.2)
42.7
(5.9)
38.5
(3.6)
48.9
(9.4)
Mean minimum °F (°C)29.1
(−1.6)
31.7
(−0.2)
35.1
(1.7)
37.9
(3.3)
44.1
(6.7)
49.5
(9.7)
54.1
(12.3)
53.8
(12.1)
49.6
(9.8)
41.7
(5.4)
32.7
(0.4)
28.7
(−1.8)
26.9
(−2.8)
Record low °F (°C)20
(−7)
23
(−5)
26
(−3)
31
(−1)
34
(1)
41
(5)
48
(9)
48
(9)
42
(6)
35
(2)
26
(−3)
18
(−8)
18
(−8)
Average precipitation inches (mm)3.66
(93)
3.49
(89)
2.68
(68)
1.26
(32)
0.75
(19)
0.23
(5.8)
0.00
(0.00)
0.04
(1.0)
0.09
(2.3)
0.85
(22)
1.66
(42)
3.43
(87)
18.14
(461)
Average precipitation days (≥ 0.01 in)10.09.19.05.13.61.10.10.20.73.16.19.657.7
Average relative humidity (%)83.376.871.664.558.955.053.255.757.063.175.682.966.5
Average dew point °F (°C)39.4
(4.1)
42.1
(5.6)
42.8
(6.0)
43.7
(6.5)
46.9
(8.3)
50.4
(10.2)
53.1
(11.7)
53.4
(11.9)
50.9
(10.5)
47.5
(8.6)
43.7
(6.5)
39.2
(4.0)
46.1
(7.8)
Mean monthly sunshine hours 145.5201.3278.0329.6406.3419.5440.2406.9347.8296.7194.9141.13,607.8
Percent possible sunshine 48677583929498969386644881
Source: NOAA (relative humidity, dew point and sun 1961–1990) [36] [37] [38]
Climate data for Sacramento 5 ESE, California (Sacramento State [39] ), 1991–2020 normals, extremes 1877–present
MonthJanFebMarAprMayJunJulAugSepOctNovDecYear
Record high °F (°C)79
(26)
80
(27)
90
(32)
98
(37)
107
(42)
112
(44)
114
(46)
112
(44)
116
(47)
102
(39)
86
(30)
72
(22)
116
(47)
Mean maximum °F (°C)66.4
(19.1)
72.5
(22.5)
80.6
(27.0)
89.5
(31.9)
97.1
(36.2)
104.4
(40.2)
106.7
(41.5)
105.5
(40.8)
102.0
(38.9)
92.3
(33.5)
77.3
(25.2)
65.9
(18.8)
108.1
(42.3)
Mean daily maximum °F (°C)56.5
(13.6)
62.2
(16.8)
67.8
(19.9)
73.5
(23.1)
81.3
(27.4)
89.0
(31.7)
94.4
(34.7)
93.5
(34.2)
89.3
(31.8)
78.9
(26.1)
65.3
(18.5)
56.4
(13.6)
75.7
(24.3)
Daily mean °F (°C)48.8
(9.3)
52.9
(11.6)
57.2
(14.0)
61.4
(16.3)
67.7
(19.8)
73.9
(23.3)
77.9
(25.5)
77.3
(25.2)
74.0
(23.3)
65.9
(18.8)
55.3
(12.9)
48.5
(9.2)
63.4
(17.4)
Mean daily minimum °F (°C)41.1
(5.1)
43.7
(6.5)
46.7
(8.2)
49.3
(9.6)
54.0
(12.2)
58.7
(14.8)
61.4
(16.3)
61.0
(16.1)
58.8
(14.9)
52.9
(11.6)
45.3
(7.4)
40.7
(4.8)
51.1
(10.6)
Mean minimum °F (°C)32.5
(0.3)
35.4
(1.9)
38.8
(3.8)
41.6
(5.3)
47.2
(8.4)
51.9
(11.1)
55.9
(13.3)
55.9
(13.3)
52.4
(11.3)
45.1
(7.3)
36.2
(2.3)
31.9
(−0.1)
30.5
(−0.8)
Record low °F (°C)19
(−7)
21
(−6)
29
(−2)
34
(1)
37
(3)
43
(6)
47
(8)
48
(9)
44
(7)
34
(1)
27
(−3)
17
(−8)
17
(−8)
Average precipitation inches (mm)3.87
(98)
3.63
(92)
2.82
(72)
1.44
(37)
0.86
(22)
0.21
(5.3)
0.00
(0.00)
0.02
(0.51)
0.15
(3.8)
0.93
(24)
1.78
(45)
3.49
(89)
19.20
(488)
Average precipitation days (≥ 0.01 in)10.89.69.25.33.71.20.10.20.83.16.810.160.9
Source: NOAA [36] [40] [41] , Western Regional Climate Center [42]

MonthJanFebMarAprMayJunJulAugSepOctNovDecYear
Record high °F (°C)79
(26)
81
(27)
87
(31)
94
(34)
97
(36)
103
(39)
99
(37)
98
(37)
106
(41)
102
(39)
86
(30)
76
(24)
106
(41)
Mean maximum °F (°C)67.1
(19.5)
71.8
(22.1)
76.4
(24.7)
80.7
(27.1)
81.4
(27.4)
84.6
(29.2)
80.5
(26.9)
83.4
(28.6)
90.8
(32.7)
87.9
(31.1)
75.8
(24.3)
66.4
(19.1)
94.0
(34.4)
Mean daily maximum °F (°C)57.8
(14.3)
60.4
(15.8)
62.1
(16.7)
63.0
(17.2)
64.1
(17.8)
66.5
(19.2)
66.3
(19.1)
67.9
(19.9)
70.2
(21.2)
69.8
(21.0)
63.7
(17.6)
57.9
(14.4)
64.1
(17.8)
Daily mean °F (°C)52.2
(11.2)
54.2
(12.3)
55.5
(13.1)
56.4
(13.6)
57.8
(14.3)
59.7
(15.4)
60.3
(15.7)
61.7
(16.5)
62.9
(17.2)
62.1
(16.7)
57.2
(14.0)
52.5
(11.4)
57.7
(14.3)
Mean daily minimum °F (°C)46.6
(8.1)
47.9
(8.8)
48.9
(9.4)
49.7
(9.8)
51.4
(10.8)
53.0
(11.7)
54.4
(12.4)
55.5
(13.1)
55.6
(13.1)
54.4
(12.4)
50.7
(10.4)
47.0
(8.3)
51.3
(10.7)
Mean minimum °F (°C)40.5
(4.7)
42.0
(5.6)
43.7
(6.5)
45.0
(7.2)
48.0
(8.9)
50.1
(10.1)
51.6
(10.9)
52.9
(11.6)
52.0
(11.1)
49.9
(9.9)
44.9
(7.2)
40.7
(4.8)
38.8
(3.8)
Record low °F (°C)29
(−2)
31
(−1)
33
(1)
40
(4)
42
(6)
46
(8)
47
(8)
46
(8)
47
(8)
43
(6)
38
(3)
27
(−3)
27
(−3)
Average precipitation inches (mm)4.40
(112)
4.37
(111)
3.15
(80)
1.60
(41)
0.70
(18)
0.20
(5.1)
0.01
(0.25)
0.06
(1.5)
0.10
(2.5)
0.94
(24)
2.60
(66)
4.76
(121)
22.89
(581)
Average precipitation days (≥ 0.01 in)11.210.810.86.84.01.60.71.11.23.57.911.671.2
Average relative humidity (%)80777572727175757371757875
Mean monthly sunshine hours 185.9207.7269.1309.3325.1311.4313.3287.4271.4247.1173.4160.63,061.7
Percent possible sunshine 61697378747070687371575469
Average ultraviolet index 235791010975326
Source 1: NOAA (sun 1961–1974) [43] [44] [45] [46]
Source 2: Met Office (humidity) [47] , Weather Atlas (UV) [48]
MonthJanFebMarAprMayJunJulAugSepOctNovDecYear
Record high °F (°C)88
(31)
91
(33)
99
(37)
98
(37)
98
(37)
101
(38)
100
(38)
98
(37)
111
(44)
107
(42)
100
(38)
88
(31)
111
(44)
Mean maximum °F (°C)78.8
(26.0)
78.6
(25.9)
80.2
(26.8)
82.1
(27.8)
79.3
(26.3)
79.6
(26.4)
82.9
(28.3)
85.2
(29.6)
90.6
(32.6)
87.8
(31.0)
85.4
(29.7)
77.0
(25.0)
94.0
(34.4)
Mean daily maximum °F (°C)66.4
(19.1)
66.2
(19.0)
67.0
(19.4)
68.8
(20.4)
69.5
(20.8)
71.7
(22.1)
75.3
(24.1)
77.3
(25.2)
77.2
(25.1)
74.6
(23.7)
70.7
(21.5)
66.0
(18.9)
70.9
(21.6)
Daily mean °F (°C)58.4
(14.7)
59.0
(15.0)
60.7
(15.9)
62.9
(17.2)
64.8
(18.2)
67.2
(19.6)
70.7
(21.5)
72.4
(22.4)
71.7
(22.1)
68.1
(20.1)
62.7
(17.1)
57.9
(14.4)
64.7
(18.2)
Mean daily minimum °F (°C)50.3
(10.2)
51.8
(11.0)
54.5
(12.5)
57.1
(13.9)
60.0
(15.6)
62.6
(17.0)
66.1
(18.9)
67.5
(19.7)
66.2
(19.0)
61.5
(16.4)
54.8
(12.7)
49.8
(9.9)
58.5
(14.7)
Mean minimum °F (°C)43.7
(6.5)
46.1
(7.8)
48.7
(9.3)
51.9
(11.1)
55.8
(13.2)
59.3
(15.2)
63.0
(17.2)
63.9
(17.7)
61.8
(16.6)
55.5
(13.1)
48.2
(9.0)
43.0
(6.1)
42.6
(5.9)
Record low °F (°C)25
(−4)
34
(1)
36
(2)
39
(4)
45
(7)
50
(10)
54
(12)
54
(12)
50
(10)
43
(6)
36
(2)
32
(0)
25
(−4)
Average precipitation inches (mm)1.98
(50)
2.20
(56)
1.46
(37)
0.65
(17)
0.28
(7.1)
0.05
(1.3)
0.08
(2.0)
0.01
(0.25)
0.12
(3.0)
0.50
(13)
0.79
(20)
1.67
(42)
9.79
(249)
Average precipitation days (≥ 0.01 in)6.57.16.23.82.20.70.70.30.92.43.75.840.3
Average relative humidity (%)63.165.767.367.070.674.074.674.172.769.466.363.769.0
Average dew point °F (°C)42.8
(6.0)
45.3
(7.4)
47.3
(8.5)
49.5
(9.7)
53.1
(11.7)
57.0
(13.9)
61.2
(16.2)
62.4
(16.9)
60.6
(15.9)
55.6
(13.1)
48.6
(9.2)
43.2
(6.2)
52.2
(11.2)
Mean monthly sunshine hours 239.3227.4261.0276.2250.5242.4304.7295.0253.3243.4230.1231.33,054.6
Percent possible sunshine 75747071585770716869737469
Source: NOAA (sun, relative humidity, and dew point 1961–1990) [50] [51] [52]
  1. Mean maxima and minima (i.e., the highest and lowest temperature readings during an entire month or year) calculated based on data at said location from 1991 to 2020.
  2. Official records for Fresno kept September 1881 to 15 August 1887 at downtown, 16 August 1887 to June 1939 at Fresno City Offices, July 1939 to 20 August 1949 at Chandler Field, and at Fresno Yosemite Int'l since 21 August 1949. For more information, see Threadex
  3. Official records for Sacramento were kept exclusively at the airport since 10 November 1941. [35]
  4. The coordinates of the station are 37°46′14″N122°25′37″W / 37.7706°N 122.4269°W . Precipitation, high temperature, low temperature, snow, and snow depth records date from October 1, 1849; June 1, 1874; January 1, 1875; January 1, 1876; and January 1, 1922; respectively.
  5. Mean monthly maxima and minima (i.e. the expected highest and lowest temperature readings at any point during the year or given month) calculated based on data at said location from 1991 to 2020.
  6. Mean monthly maxima and minima (i.e. the highest and lowest temperature readings during an entire month or year) calculated based on data at said location from 1991 to 2020.
  7. Official precipitation records for San Diego were kept at the Weather Bureau Office in downtown from October 1850 to December 1859 at the Mission San Diego and from November 1871 to June 1939 and a variety of buildings at downtown, and at San Diego Int'l (Lindbergh Field) since July 1939. [49] Temperature records, however, only date from October 1874. For more information on data coverage, see ThreadEx

Precipitation

Average annual precipitation CAprecipitation.png
Average annual precipitation
Percent Area in U.S. Drought Monitor Categories Drought area in California.svg
Percent Area in U.S. Drought Monitor Categories

The prevailing westerly winds from the oceans also bring moisture, and the northern parts of the state generally receive higher annual rainfall amounts than the south. California's mountain ranges influence the climate as well: moisture-laden air from the west cools as it ascends the mountains, dropping moisture; some of the rainiest parts of the state are west-facing mountain slopes. Northwestern California has a temperate climate with rainfall of 15 inches (380 mm) to 50 inches (1,300 mm) per year. Some areas of Coast Redwood forest receive over 100 inches (2,500 mm) of precipitation per year.

The Central Valley has a wide range of precipitation. The northern parts of the Central Valley receive substantially greater precipitation from winter storms which sweep down from the Pacific Northwest, while the southernmost regions of the Central Valley are near desert-like because of a lack of precipitation.

The high mountains, including the Sierra Nevada, the Cascade Range, and the Klamath Mountains, have a mountain climate with snow in winter and mild to moderate heat in summer. Ski resorts at Lake Tahoe, Mammoth Lakes, and Mount Shasta routinely receive over 10 feet (3.0 m) of snow in a season, and some years, substantially more – leading, for example, to annual ski races on the Fourth of July.

On the east side of the mountains is a drier rain shadow. California's desert climate regions lie east of the high Sierra Nevada and southern California's Transverse Ranges and Peninsular Ranges. The low deserts east of the southern California mountains, including the Imperial and Coachella valleys and the lower Colorado River, are part of the Sonoran Desert, with minimal frost in the winter; the higher elevation deserts of eastern California, including the Mojave Desert, Owens Valley, and the Modoc Plateau, are part of the Great Basin region, which has a more continental climate. During the summer months, especially from July through early September, the region is affected by the Mexican Monsoon (also called the "southwest monsoon"), which drives moisture from the tropical Pacific, Gulf of California, and/or Gulf of Mexico into the deserts, setting off brief, but often torrential thunderstorms, particularly over mountainous terrain.

The ENSO cycle has a huge effect on rainfall and snowfall patterns in California, especially during the winter and spring seasons. During the El Niño phase, the jet stream is located south through California, allowing for warmer temperatures and more heavy rains to occur, particularly in the southern portions of the state. During the La Niña phase, the jet stream is much further north, and therefore the far northern portions of California are wetter, while the southern half stays cool and dry.

Fog

Incidences of dense fog in Los Angeles have been decreasing over time; researchers surmise the change may be a consequence of both the urban heat Island effect and decreased air pollution. [53]

In the Central Valley during the winter months and in times of clear skies and light winds, the moisture from the Pacific can produce the tule fog, which is exceptionally thick fog that is visible on satellite imagery. [54] The tule fog, named after the local tule grass wetlands, can reduce visibility to near zero, making it the primary cause of weather-related traffic accidents in the state. On November 3, 2007, a sudden patch of dense fog along California State Route 99 (SR 99) resulted in a traffic crash involving 108 vehicles in Fresno, which killed two people and at least 36 injuries. Following the accident, the California Department of Transportation (Caltrans) developed a fog warning system along a 13 mi (21 km) section of SR 99. [55] [56]

Tornadoes

Across the state, tornadoes develop in three main regions the Los Angeles area, the deserts of Southern California, the Central Valley. However, they are typically weaker and shorter-lived than tornadoes in the central United States. [57] [58] Because of their irregular and short-lived nature, the San Diego National Weather Service considers it "nearly impossible to forecast a Southern California tornado before it touches down." The agency utilizes a volunteer group of more than 1,300 volunteers to report local severe weather. [59] The most California tornadoes on a single day in the state was seven, which occurred on November 9, 1982. [58] In July 2004, a twister touched down in Sequoia National Park at an altitude of around 12,156 ft (3,705 m), making it the highest elevation for a confirmed tornado in the United States. [60]

Tropical cyclones

Despite its long coastline, California is not vulnerable to tropical cyclones. Because of the cold California Current from the North Pacific Ocean and the fact that the storms tend to "steer" west, California has only been hit with three tropical storms in recorded history, a storm which came ashore in 1939 and dumped heavy rainfall on the Los Angeles area and interior deserts. The remnants of tropical systems will affect California more commonly, every several years.

Wildfires

Active flame front of the Zaca Fire Zaca3.jpg
Active flame front of the Zaca Fire

Summers in inland California can see temperatures well over 100 °F (38 °C) during the day and less than 0.3 in (7.6 mm) of monthly rainfall, particularly in the southern areas. This makes them prone to wildfires. These can be life-threatening and cause evacuation. Wildfires are less common along the coast because of the cooler, more humid summers, but can occur in autumn when the marine layer is less common, making temperatures warmer and humidity drop significantly.

On occasion, fire whirls or fire tornadoes can develop within wildfires. One such event was rated an EF3, which developed in Redding in Shasta County within the Carr Fire. The fire whirl produced winds over 143 mph (230 km/h), killing four people and injuring six others. [61]

Winds

In February 2017, a winter storm produced a wind gust of 199 mph (320 km/h) at Ward Peak in Alpine Meadows ski resort. [62]

Glossary

The following are terms used to describe local or regional weather events.

See also

Related Research Articles

<span class="mw-page-title-main">Central Valley (California)</span> Flat valley that dominates central California

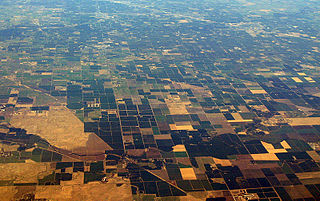
The Central Valley is a broad, elongated, flat valley that dominates the interior of California. It is 40–60 mi (60–100 km) wide and runs approximately 450 mi (720 km) from north-northwest to south-southeast, inland from and parallel to the Pacific coast of the state. It covers approximately 18,000 sq mi (47,000 km2), about 11% of California's land area. The valley is bounded by the Coast Ranges to the west and the Sierra Nevada to the east.

<span class="mw-page-title-main">Climate of Missouri</span> Overview of the climate of Missouri, United States

Missouri generally has a variety of seasonal humid subtropical climate, with cool winters and long, hot summers. In the southern part of the state, particularly in the Bootheel, the climate borders on a more mild-type humid subtropical climate, and in the northern third, the state transitions into a humid continental climate. Because of its location in the interior United States, Missouri often experiences extremes in temperatures. Lacking either large mountains or oceans nearby to moderate its temperature, its climate is alternately influenced by air from the cold Arctic and the hot and humid Gulf of Mexico.

<span class="mw-page-title-main">Sacramento Valley</span> Area of the Central Valley in California

The Sacramento Valley is the area of the Central Valley of the U.S. state of California that lies north of the Sacramento–San Joaquin River Delta and is drained by the Sacramento River. It encompasses all or parts of ten Northern California counties. Although many areas of the Sacramento Valley are rural, it contains several urban areas, including the state capital, Sacramento. Since 2010, statewide droughts in California have further strained both the Sacramento Valley's and the Sacramento metropolitan region's water security.

<span class="mw-page-title-main">June Gloom</span> Weather phenomenon where clouds develop and temperatures cool over coastal California

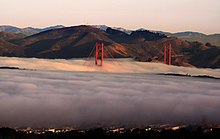
June Gloom is a mainly Southern California term for a weather pattern that results in cloudy, overcast skies with cool temperatures during the late spring and early summer. While it is most common in the month of June, it can occur in surrounding months, giving rise to other colloquialisms, such as “Graypril,” "May Gray," "No-Sky July," and "Fogust." Low-altitude stratus clouds form over the cool water of the California Current, and spread overnight into the coastal regions of California.

<span class="mw-page-title-main">Climate of Virginia</span> Overview of the climate of the U.S. state of Virginia

The climate of Virginia, a state on the east coast of the United States, is mild compared to more northern areas of the United States such as New England and the Midwest. Most of Virginia east of the Blue Ridge mountains, the southern part of the Shenandoah Valley, and the Roanoke Valley, has a humid subtropical climate. In the mountainous areas west of the Blue Ridge, the climate is warm-summer humid continental or oceanic climate. Severe weather, in the form of tornadoes, tropical cyclones, and winter storms, impacts the state on a regular basis. Central Virginia received significant snowfall of 20 inches in December 2009.

<span class="mw-page-title-main">Tule fog</span> Annual fog event in Californias Central Valley

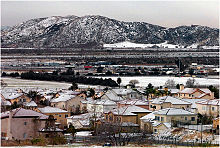
Tule fog is a thick ground fog that settles in the San Joaquin Valley and Sacramento Valley areas of California's Central Valley. Tule fog forms from late fall through early spring after the first significant rainfall. The official time frame for tule fog to form is from November 1 to March 31. This phenomenon is named after the tule grass wetlands (tulares) of the Central Valley. As of 2005, tule fog was the leading cause of weather-related accidents in California.

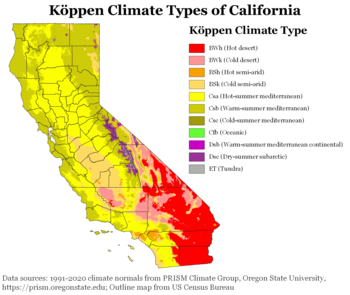
The climate of San Diego, California is classified as a hot-summer Mediterranean climate. The basic climate features hot, sunny, and dry summers, and cooler, wetter winters. However, San Diego is much more arid than typical Mediterranean climates, and winters are still dry compared with most other zones with this type of climate. The climate at San Diego International Airport, the location for official weather reports for San Diego, as well as the climate at most beach areas, straddles the border between BSh and BSk due to the mild winters and cool summers in these locations.

The Climate of Grand Forks, North Dakota is a warm summer continental typical of cities located in the Great Plains, with four very distinct seasons and great variation in temperatures over very short periods of time. The city's climate is characterized by long, cold winters with moderate snowfall and warm summers which are typically humid.

<span class="mw-page-title-main">Climate of North Dakota</span>

North Dakota's climate is typical of a continental climate with cold winters and warm-hot summers. The state's location in the Upper Midwest allows it to experience some of the widest variety of weather in the United States, and each of the four seasons has its own distinct characteristics. The eastern half of the state has a humid continental climate with warm to hot, somewhat humid summers and cold, windy winters, while the western half has a semi-arid climate with less precipitation and less humidity but similar temperature profiles. The areas east of the Missouri River get slightly colder winters, while those west of the stream get higher summer daytime temperatures. In general, the diurnal temperature difference is prone to be more significant in the west due to higher elevation and less humidity.

<span class="mw-page-title-main">Climate of Romania</span>

The climate of Romania is continental, transitioning into humid subtropical on the eastern coast, influenced by polar intrusions, and therefore characterized by harsh winters. The mountain ranges of the Carpathian arc have a cool mountain climate with high humidity throughout the year.

<span class="mw-page-title-main">Climate of Pennsylvania</span> Overview of the climate of the U.S. state of Pennsylvania

The climate of Pennsylvania is diverse due to the multitude of geographic features found within the state. Straddling two major climate zones, the southeastern corner of Pennsylvania has the warmest climate. A portion of Greater Philadelphia lies at the southernmost tip of the humid continental climate zone, with the city proper being in the humid subtropical climate zone. Still, Philadelphia features colder, snowier winters than most locations with a humid subtropical climate. Moving west toward the mountainous interior of the state, the climate becomes markedly colder, the number of cloudy days increases, and winter snowfall amounts are greater.

<span class="mw-page-title-main">Geography of Nevada</span>

The landlocked U.S. state of Nevada has a varied geography and is almost entirely within the Basin and Range Province and is broken up by many north–south mountain ranges. Most of these ranges have endorheic valleys between them.

<span class="mw-page-title-main">Geography of Idaho</span> Overview of the Geograpny of Idaho

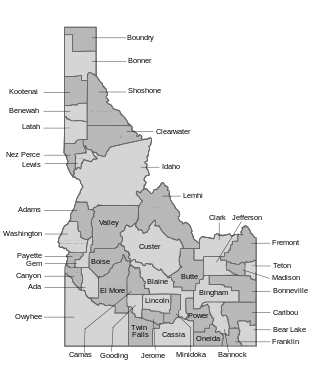
The U.S. state of Idaho borders six other U.S. states and one Canadian province. The states of Washington and Oregon are to the west, Nevada and Utah are to the south, and Montana and Wyoming are to the east. Idaho also shares a short border with the Canadian province of British Columbia to the north.

<span class="mw-page-title-main">Climate of New York (state)</span> Overview of the climate of the U.S. state of New York

The climate of New York (state) is generally humid continental, while the extreme southeastern portion of the state lies in the warmer humid subtropical climate zone. Winter temperatures average below freezing during January and February in much of the state of New York, but several degrees above freezing along the Atlantic coastline, including New York City.

<span class="mw-page-title-main">Climate of Russia</span> Characteristics of the climate of Russia

The climate of Russia is formed under the influence of several determining factors. The enormous size of the country and the remoteness of many areas from the sea result in the dominance of the continental climate, which is prevalent in European and Asian Russia except for the tundra and the extreme southwest. Mountains in the south obstructing the flow of warm air masses from the Indian Ocean and the plain of the west and north makes the country open to Arctic and Atlantic influences.

<span class="mw-page-title-main">Climate of Los Angeles</span>

The climate of Los Angeles is mild to hot year-round, and mostly dry. It is classified as borderline Mediterranean and semi-arid. The city is characterized by seasonal changes in rainfall—with a dry summer and a winter rainy season. Under the Köppen climate classification, the coastal areas are classified as BSh and Csb, while the inland areas are classified as BSh and Csa.

<span class="mw-page-title-main">Scott Lake (Washington)</span>

Scott Lake is a lake in Thurston County, Washington, United States. It is located 3.2 miles (5.1 km) south of the Tumwater city limits, 8.4 miles (13.5 km) south of the Olympia city limits, and 14.1 miles (22.7 km) north of the Centralia city limits. The location for Scott Lake is in Sections 33 and 34, Township 17N, Range 2W, Willamette Meridian.

<span class="mw-page-title-main">Geography of Washington (state)</span> Overview of the Geography of Washington

Washington is the northwesternmost state of the contiguous United States. It borders Idaho to the east, bounded mostly by the meridian running north from the confluence of the Snake River and Clearwater River, except for the southernmost section where the border follows the Snake River. Oregon is to the south, with the Columbia River forming the western part and the 46th parallel forming the eastern part of the Oregon–Washington border. During Washington's partition from Oregon, the original plan for the border followed the Columbia River east until the confluence with the Snake, and then would have followed the Snake River east; this was changed to keep Walla Walla's fertile farmland in Washington.

<span class="mw-page-title-main">Climate of New England</span> Overview of the climate of New England

The climate of New England varies greatly across its 500-mile (800 km) span from northern Maine to southern Connecticut.

References

  1. 1 2 "San Francisco Downtown, California". National Climatic Data Center (NCDC) 1981-2010 Monthly Normals. Western Regional Climate Center (WRCC), National Oceanic and Atmospheric Administration (NOAA).
  2. "San Francisco Oceanside, California". National Climatic Data Center (NCDC) 1981-2010 Monthly Normals. Western Regional Climate Center (WRCC), National Oceanic and Atmospheric Administration (NOAA).
  3. average temperatures in Walnut Creek.
  4. Average temperatures in Santa Monica compared to average temperatures in Burbank.
  5. 1981–2010 Monthly Climate Normals
  6. El Fadli, KI; et al. (September 2012). "World Meteorological Organization Assessment of the Purported World Record 58°C Temperature Extreme at El Azizia, Libya (13 September 1922)". Bulletin of the American Meteorological Society. 94 (2): 199–204. Bibcode:2013BAMS...94..199E. doi: 10.1175/BAMS-D-12-00093.1 . (The 136.4 °F (58 °C), claimed by 'Aziziya, Libya, on September 13, 1922, has been officially deemed invalid by the World Meteorological Organization.)
  7. "World Meteorological Organization World Weather / Climate Extremes Archive". Archived from the original on January 4, 2013. Retrieved January 10, 2013.
  8. "Alturas, California". National Climatic Data Center (NCDC) 1981-2010 Monthly Normals. Western Regional Climate Center (WRCC), National Oceanic and Atmospheric Administration (NOAA).
  9. "Bakersfield Airport, California". National Climatic Data Center (NCDC) 1981-2010 Monthly Normals. Western Regional Climate Center (WRCC), National Oceanic and Atmospheric Administration (NOAA).
  10. "Bishop Airport, California". National Climatic Data Center (NCDC) 1981-2010 Monthly Normals. Western Regional Climate Center (WRCC), National Oceanic and Atmospheric Administration (NOAA).
  11. "Bodie, California". National Climatic Data Center (NCDC) 1981-2010 Monthly Normals. Western Regional Climate Center (WRCC), National Oceanic and Atmospheric Administration (NOAA).
  12. "Death Valley". National Climatic Data Center (NCDC) 1981-2010 Monthly Normals. Western Regional Climate Center (WRCC), National Oceanic and Atmospheric Administration (NOAA).
  13. "Eureka WFO Woodley Island, California". National Climatic Data Center (NCDC) 1981-2010 Monthly Normals. Western Regional Climate Center (WRCC), National Oceanic and Atmospheric Administration (NOAA).
  14. "Fresno Yosemite International Airport, California". National Climatic Data Center (NCDC) 1981-2010 Monthly Normals. Western Regional Climate Center (WRCC), National Oceanic and Atmospheric Administration (NOAA).
  15. "Los Angeles Downtown University of Southern California Campus, California". National Climatic Data Center (NCDC) 1981-2010 Monthly Normals. Western Regional Climate Center (WRCC), National Oceanic and Atmospheric Administration (NOAA).
  16. "Needles Airport, California". National Climatic Data Center (NCDC) 1981-2010 Monthly Normals. Western Regional Climate Center (WRCC), National Oceanic and Atmospheric Administration (NOAA).
  17. "Redding Municipal Airport". National Climatic Data Center (NCDC) 1981-2010 Monthly Normals. Western Regional Climate Center (WRCC), National Oceanic and Atmospheric Administration (NOAA).
  18. "Riverside Fire Station 3, California". National Climatic Data Center (NCDC) 1981-2010 Monthly Normals. Western Regional Climate Center (WRCC), National Oceanic and Atmospheric Administration (NOAA).
  19. "Sacramento Executive Airport, California". National Climatic Data Center (NCDC) 1981-2010 Monthly Normals. Western Regional Climate Center (WRCC), National Oceanic and Atmospheric Administration (NOAA).
  20. "San Diego Lindbergh Field, California". National Climatic Data Center (NCDC) 1981-2010 Monthly Normals. Western Regional Climate Center (WRCC), National Oceanic and Atmospheric Administration (NOAA).
  21. "San Jose". National Climatic Data Center (NCDC) 1981-2010 Monthly Normals. Western Regional Climate Center (WRCC), National Oceanic and Atmospheric Administration (NOAA).
  22. "Santa Rosa, California". National Climatic Data Center (NCDC) 1981-2010 Monthly Normals. Western Regional Climate Center (WRCC), National Oceanic and Atmospheric Administration (NOAA).
  23. "South Lake Tahoe Airport, California". National Climatic Data Center (NCDC) 1981-2010 Monthly Normals. Western Regional Climate Center (WRCC), National Oceanic and Atmospheric Administration (NOAA).
  24. "NowData – NOAA Online Weather Data". National Oceanic and Atmospheric Administration . Retrieved October 16, 2021.
  25. "Summary of Monthly Normals 1991–2020". National Oceanic and Atmospheric Administration. Archived from the original on August 10, 2023. Retrieved October 16, 2021.
  26. "WMO Climate Normals for FRESNO/AIR TERMINAL CA 1961–1990". National Oceanic and Atmospheric Administration. Archived from the original on August 10, 2023. Retrieved March 11, 2014.
  27. 1 2 "NowData – NOAA Online Weather Data". National Oceanic and Atmospheric Administration . Retrieved July 18, 2020.
  28. "Summary of Monthly Normals 1991–2020". National Oceanic and Atmospheric Administration. Retrieved May 11, 2021.
  29. "Station Name: CA LOS ANGELES DWTN USC CAMPUS". National Oceanic and Atmospheric Administration. Retrieved July 18, 2020.
  30. "LOS ANGELES/WBO CA Climate Normals". National Oceanic and Atmospheric Administration . Retrieved October 20, 2013.
  31. "Historical UV Index Data - Los Angeles, CA". UV Index Today. Retrieved April 21, 2023.
  32. "Station Name: CA LOS ANGELES INTL AP". National Oceanic and Atmospheric Administration. Retrieved May 9, 2014.
  33. "Summary of Monthly Normals 1991–2020". National Oceanic and Atmospheric Administration. Retrieved May 11, 2021.
  34. "WMO Climate Normals for LOS ANGELES/INTL, CA 1961–1990". National Oceanic and Atmospheric Administration. Retrieved April 17, 2014.
  35. "Threaded Extremes". threadex.rcc-acis.org.
  36. 1 2 "NowData – NOAA Online Weather Data". National Oceanic and Atmospheric Administration . Retrieved October 14, 2021.
  37. "Summary of Monthly Normals SACRAMENTO EXECUTIVE AP, CA US 1991-2020". National Oceanic and Atmospheric Administration. Archived from the original on July 5, 2023. Retrieved October 14, 2021.
  38. "WMO Climate Normals for SACRAMENTO/EXECUTIVE ARPT CA 1961–1990". National Oceanic and Atmospheric Administration. Archived from the original on July 5, 2023. Retrieved July 19, 2020.
  39. Reese, Phillip (January 7, 2015). "2014 was hottest year in Sacramento's history". Sacramento Bee.
  40. "Summary of Monthly Normals SACRAMENTO 5 ESE, CA US 1991-2020". National Oceanic and Atmospheric Administration . Retrieved October 14, 2021.
  41. "Global Summary of the Month". National Oceanic and Atmospheric Administration . Retrieved October 14, 2021.
  42. "SACRAMENTO 5 ESE, CALIFORNIA". Western Regional Climate Center.
  43. "NOAA Climate Data". National Oceanic and Atmospheric Administration . Retrieved February 6, 2019.
  44. "Summary of Monthly Normals 1991–2020". National Oceanic and Atmospheric Administration. Retrieved May 5, 2021.
  45. "Station Name: CA SAN FRANCISCO DWTN". National Oceanic and Atmospheric Administration. Retrieved March 18, 2014.
  46. "San Francisco/Mission Dolores, CA Climate Normals 1961–1990". National Oceanic and Atmospheric Administration. Retrieved April 23, 2013.
  47. "San Francisco holiday weather". Met Office. Retrieved September 18, 2017.
  48. "Climate and monthly weather forecast San Francisco, CA" . Retrieved August 16, 2022.
  49. Conner, Glen. History of weather observations San Diego, California 1849–1948. Climate Database Modernization Program, NOAA's National Climatic Data Center. pp. 7–8.
  50. "NowData – NOAA Online Weather Data". National Oceanic and Atmospheric Administration . Retrieved June 14, 2021.
  51. "Summary of Monthly Normals 1991–2020". National Oceanic and Atmospheric Administration. Archived from the original on August 8, 2023. Retrieved June 14, 2021.
  52. "San Diego/Lindbergh Field CA Climate Normals 1961–1990". National Oceanic and Atmospheric Administration. Archived from the original on August 8, 2023. Retrieved July 18, 2020.
  53. LaDochy, Steve (January 2005). "The Disappearance of Dense Fog in Los Angeles: Another Urban Impact?". Physical Geography. 26 (3): 177–191. doi:10.2747/0272-3646.26.3.177. ISSN   0272-3646.
  54. "Radiation Fog". National Weather Service. Retrieved January 13, 2024.
  55. "Best Practices for Road Weather Management". United States Department of Transportation. June 22, 2020. Retrieved January 13, 2024.
  56. Rong-Gong Lin II; Kenneth R. Weiss (November 4, 2007). "2 killed in huge pileup in tule fog on California 99". Los Angeles Times. Retrieved January 13, 2024.
  57. James H. Mathews (September 2009). The Presidents' Day 2005 Tornadoes in the Southern Sacramento Valley of Northern California (PDF). Sacramento, California National Weather Service (Report). Retrieved August 22, 2023.
  58. 1 2 John E. Hales, Jr. (June 1985). "Synoptic Features Associated with Los Angeles Tornado Occurrences" (PDF). Bulletin of the American Meteorological Society. 66 (6). Retrieved December 14, 2023.
  59. Miguel Miller, ed. (2012). The Weather Guide: A Weather Information Companion for the forecast area of the National Weather Service in San Diego (PDF). San Diego National Weather Service (Report) (6th ed.).
  60. John P. Monteverdi; Roger Edwards; Gregory A. Stumpf (November 1, 2014). "An Analysis of the 7 July 2004 Rockwell Pass, California, Tornado: Highest-Elevation Tornado Documented in the United States" (PDF). Monthly Weather Review. 142 (11). Retrieved August 31, 2023.
  61. National Centers for Environmental Information. "High Wind Event Report". Storm Event Database. National Oceanic and Atmospheric Administration. Retrieved August 15, 2023.
  62. "California Has A New Wind-Speed Record: 199 MPH". CBS Sacramento. Associated Press. January 12, 2018. Retrieved March 2, 2024.
  63. Miller, Craig (June 27, 2019). "No, Earthquake Weather Is Not a Real Thing". Bay Curious. KQED.