Climate of Virginia

Last updated
Koppen climate types of Virginia, using 1991-2020 climate normals Koppen Climate Types Virginia.png
Köppen climate types of Virginia, using 1991-2020 climate normals
Due to the elevation, the Blue Ridge Mountains have a humid continental climate. Shenandoah Trees.jpg
Due to the elevation, the Blue Ridge Mountains have a humid continental climate.

The climate of Virginia, a state on the east coast of the United States, is mild compared to more northern areas of the United States such as New England and the Midwest. Most of Virginia east of the Blue Ridge mountains, the southern part of the Shenandoah Valley, and the Roanoke Valley, has a humid subtropical climate (Köppen climate classification Cfa). In the mountainous areas west of the Blue Ridge, the climate is warm-summer humid continental (Köppen Dfb) or oceanic climate (Köppen Cfb). [1] [2] Severe weather, in the form of tornadoes, tropical cyclones, and winter storms, impacts the state on a regular basis. Central Virginia received significant snowfall of 20 inches in December 2009.

Contents

Climate zones

The USDA Hardiness Zones for Virginia range from Zone 5A (-20°F to -15°F) in the mountains, to Zone 8A (10°F to 15°F) along the coast.

A lot of variations occur because of the state's significant relief. Elevations in Virginia vary from sea level to Mount Rogers at 5,729 ft (1,746 m) above sea level, with major gradations occurring at the edges of the Atlantic Ocean, the end of the Piedmont, and the Blue Ridge and Allegheny chains of the Appalachian Mountains. The moderating influence of the ocean from the east, powered by the Gulf Stream, also creates the potential for hurricanes near the mouth of Chesapeake Bay. Cold air masses arrive over the mountains, especially in winter, which can lead to significant snowfalls when coastal storms known as noreasters move up the Atlantic coast.

The interaction of these elements with the state's topography create micro-climates in the Shenandoah Valley, the mountainous southwest, and the coastal plains that are slightly but noticeably distinct from each other. [3]

Statistics for selected cities

The highest recorded temperature is 115 °F (46 °C) at Balcony Falls on July 15, 1954, and the lowest recorded temperature is −30 °F (−34 °C) at Mountain Lake on January 22, 1985. [4]

Climate data for Lynchburg, Virginia (Lynchburg Regional Airport), 1991–2020 normals, [lower-alpha 1] extremes 1893–present [lower-alpha 2]
MonthJanFebMarAprMayJunJulAugSepOctNovDecYear
Record high °F (°C)80
(27)
82
(28)
92
(33)
95
(35)
100
(38)
104
(40)
106
(41)
105
(41)
102
(39)
98
(37)
84
(29)
79
(26)
106
(41)
Mean maximum °F (°C)67
(19)
70
(21)
79
(26)
86
(30)
89
(32)
93
(34)
95
(35)
94
(34)
90
(32)
84
(29)
75
(24)
68
(20)
96
(36)
Mean daily maximum °F (°C)46.0
(7.8)
49.6
(9.8)
58.2
(14.6)
68.8
(20.4)
75.9
(24.4)
83.2
(28.4)
86.9
(30.5)
85.2
(29.6)
78.9
(26.1)
68.9
(20.5)
58.2
(14.6)
49.0
(9.4)
67.4
(19.7)
Daily mean °F (°C)35.9
(2.2)
38.8
(3.8)
46.4
(8.0)
56.1
(13.4)
64.2
(17.9)
72.0
(22.2)
76.0
(24.4)
74.5
(23.6)
68.0
(20.0)
57.0
(13.9)
46.5
(8.1)
38.9
(3.8)
56.2
(13.4)
Mean daily minimum °F (°C)25.8
(−3.4)
28.0
(−2.2)
34.6
(1.4)
43.5
(6.4)
52.5
(11.4)
60.7
(15.9)
65.0
(18.3)
63.8
(17.7)
57.1
(13.9)
45.1
(7.3)
34.8
(1.6)
28.9
(−1.7)
45.0
(7.2)
Mean minimum °F (°C)7
(−14)
12
(−11)
18
(−8)
29
(−2)
38
(3)
50
(10)
56
(13)
55
(13)
43
(6)
30
(−1)
21
(−6)
14
(−10)
5
(−15)
Record low °F (°C)−10
(−23)
−11
(−24)
5
(−15)
20
(−7)
30
(−1)
40
(4)
49
(9)
45
(7)
35
(2)
21
(−6)
8
(−13)
−4
(−20)
−11
(−24)
Average precipitation inches (mm)3.46
(88)
2.91
(74)
3.76
(96)
3.45
(88)
3.98
(101)
3.82
(97)
4.19
(106)
3.22
(82)
3.96
(101)
3.12
(79)
3.39
(86)
3.50
(89)
42.76
(1,086)
Average snowfall inches (cm)3.5
(8.9)
3.6
(9.1)
2.4
(6.1)
0.1
(0.25)
0.0
(0.0)
0.0
(0.0)
0.0
(0.0)
0.0
(0.0)
0.0
(0.0)
0.0
(0.0)
0.0
(0.0)
2.0
(5.1)
11.6
(29)
Average precipitation days (≥ 0.01 in)9.99.511.110.212.110.911.89.78.57.78.19.4118.9
Average snowy days (≥ 0.1 in)1.71.81.20.10.00.00.00.00.00.00.00.95.7
Mean monthly sunshine hours 167.0168.2221.7243.7272.3287.5273.4256.6226.5215.4169.6155.92,657.8
Percent possible sunshine 54566062626561616162555260
Source: NOAA (sun 1961–1990) [5] [6] [7]
MonthJanFebMarAprMayJunJulAugSepOctNovDecYear
Record high °F (°C)84
(29)
82
(28)
92
(33)
97
(36)
100
(38)
102
(39)
105
(41)
105
(41)
100
(38)
95
(35)
86
(30)
82
(28)
105
(41)
Mean maximum °F (°C)72.4
(22.4)
74.3
(23.5)
80.7
(27.1)
86.9
(30.5)
91.5
(33.1)
95.7
(35.4)
98.4
(36.9)
95.3
(35.2)
92.0
(33.3)
86.0
(30.0)
78.9
(26.1)
73.4
(23.0)
99.3
(37.4)
Mean daily maximum °F (°C)50.7
(10.4)
53.4
(11.9)
60.1
(15.6)
70.0
(21.1)
77.4
(25.2)
85.2
(29.6)
89.4
(31.9)
86.9
(30.5)
81.4
(27.4)
72.3
(22.4)
62.1
(16.7)
54.7
(12.6)
70.3
(21.3)
Daily mean °F (°C)42.2
(5.7)
44.2
(6.8)
50.7
(10.4)
60.1
(15.6)
68.3
(20.2)
76.7
(24.8)
81.1
(27.3)
79.2
(26.2)
74.0
(23.3)
63.7
(17.6)
53.3
(11.8)
46.1
(7.8)
61.6
(16.4)
Mean daily minimum °F (°C)33.6
(0.9)
35.1
(1.7)
41.3
(5.2)
50.1
(10.1)
59.1
(15.1)
68.1
(20.1)
72.8
(22.7)
71.6
(22.0)
66.6
(19.2)
55.1
(12.8)
44.4
(6.9)
37.6
(3.1)
52.9
(11.6)
Mean minimum °F (°C)18.7
(−7.4)
21.6
(−5.8)
27.4
(−2.6)
37.0
(2.8)
46.9
(8.3)
56.0
(13.3)
64.7
(18.2)
63.7
(17.6)
55.5
(13.1)
40.4
(4.7)
29.8
(−1.2)
23.9
(−4.5)
16.8
(−8.4)
Record low °F (°C)−3
(−19)
2
(−17)
14
(−10)
23
(−5)
36
(2)
45
(7)
54
(12)
49
(9)
40
(4)
27
(−3)
17
(−8)
5
(−15)
−3
(−19)
Average precipitation inches (mm)3.41
(87)
2.90
(74)
3.69
(94)
3.37
(86)
3.78
(96)
4.43
(113)
6.08
(154)
5.88
(149)
5.40
(137)
3.86
(98)
3.10
(79)
3.28
(83)
49.18
(1,249)
Average snowfall inches (cm)3.2
(8.1)
1.5
(3.8)
0.4
(1.0)
0.0
(0.0)
0.0
(0.0)
0.0
(0.0)
0.0
(0.0)
0.0
(0.0)
0.0
(0.0)
0.0
(0.0)
0.0
(0.0)
1.1
(2.8)
6.2
(16)
Average precipitation days (≥ 0.01 in)10.79.210.910.011.29.710.610.29.47.78.99.9118.4
Average snowy days (≥ 0.1 in)1.71.30.50.00.00.00.00.00.00.00.00.54.0
Average relative humidity (%)66.365.664.662.868.870.673.375.274.472.168.567.069.1
Average dew point °F (°C)27.9
(−2.3)
28.9
(−1.7)
35.8
(2.1)
43.2
(6.2)
54.5
(12.5)
63.1
(17.3)
68.2
(20.1)
68.0
(20.0)
62.4
(16.9)
51.3
(10.7)
41.7
(5.4)
32.7
(0.4)
48.1
(9.0)
Mean monthly sunshine hours 171.5175.2229.3252.8271.7280.1278.3260.4231.4208.3175.7160.42,695.1
Percent possible sunshine 56586264626462626260575361
Average ultraviolet index 24578109975326
Source 1: NOAA (relative humidity and sun 1961–1990) [8] [9] [10]
Source 2: Weather Atlas (UV) [11]
Climate data for Richmond International Airport, Virginia (1991–2020 normals, [lower-alpha 5] extremes 1887–present [lower-alpha 6] )
MonthJanFebMarAprMayJunJulAugSepOctNovDecYear
Record high °F (°C)81
(27)
83
(28)
94
(34)
96
(36)
100
(38)
104
(40)
105
(41)
107
(42)
103
(39)
99
(37)
86
(30)
81
(27)
107
(42)
Mean maximum °F (°C)70.1
(21.2)
72.6
(22.6)
80.5
(26.9)
87.7
(30.9)
91.5
(33.1)
96.6
(35.9)
98.6
(37.0)
96.7
(35.9)
92.9
(33.8)
86.4
(30.2)
77.1
(25.1)
71.7
(22.1)
99.6
(37.6)
Mean daily maximum °F (°C)47.8
(8.8)
51.6
(10.9)
59.6
(15.3)
70.4
(21.3)
77.8
(25.4)
85.6
(29.8)
89.5
(31.9)
87.5
(30.8)
81.2
(27.3)
70.9
(21.6)
60.4
(15.8)
51.5
(10.8)
69.5
(20.8)
Daily mean °F (°C)38.3
(3.5)
41.0
(5.0)
48.4
(9.1)
58.4
(14.7)
66.7
(19.3)
75.0
(23.9)
79.4
(26.3)
77.5
(25.3)
71.2
(21.8)
60.0
(15.6)
49.6
(9.8)
41.8
(5.4)
58.9
(14.9)
Mean daily minimum °F (°C)28.8
(−1.8)
30.4
(−0.9)
37.2
(2.9)
46.4
(8.0)
55.7
(13.2)
64.5
(18.1)
69.2
(20.7)
67.6
(19.8)
61.1
(16.2)
49.0
(9.4)
38.8
(3.8)
32.1
(0.1)
48.4
(9.1)
Mean minimum °F (°C)11.1
(−11.6)
16.0
(−8.9)
21.6
(−5.8)
31.9
(−0.1)
42.1
(5.6)
53.4
(11.9)
60.9
(16.1)
59.3
(15.2)
48.8
(9.3)
34.4
(1.3)
24.3
(−4.3)
18.2
(−7.7)
9.1
(−12.7)
Record low °F (°C)−12
(−24)
−10
(−23)
10
(−12)
19
(−7)
31
(−1)
40
(4)
51
(11)
46
(8)
35
(2)
21
(−6)
10
(−12)
−2
(−19)
−12
(−24)
Average precipitation inches (mm)3.23
(82)
2.61
(66)
4.00
(102)
3.18
(81)
4.00
(102)
4.64
(118)
4.37
(111)
4.90
(124)
4.61
(117)
3.39
(86)
3.06
(78)
3.51
(89)
45.50
(1,156)
Average snowfall inches (cm)3.7
(9.4)
2.2
(5.6)
1.1
(2.8)
0.0
(0.0)
0.0
(0.0)
0.0
(0.0)
0.0
(0.0)
0.0
(0.0)
0.0
(0.0)
0.0
(0.0)
0.0
(0.0)
1.8
(4.6)
8.8
(22)
Average precipitation days (≥ 0.01 in)10.09.010.810.511.110.611.49.49.38.18.410.0118.6
Average snowy days (≥ 0.1 in)1.91.71.00.60.00.00.00.00.00.00.10.95.6
Average relative humidity (%)67.965.663.060.869.572.274.877.277.073.869.168.970.0
Average dew point °F (°C)24.8
(−4.0)
26.4
(−3.1)
33.6
(0.9)
41.5
(5.3)
54.1
(12.3)
63.0
(17.2)
67.6
(19.8)
67.3
(19.6)
60.6
(15.9)
48.4
(9.1)
38.1
(3.4)
29.5
(−1.4)
46.2
(7.9)
Mean monthly sunshine hours 172.5179.7233.3261.6288.0306.4301.4278.9237.9222.8183.5163.02,829
Percent possible sunshine 56596366656967666464605564
Average ultraviolet index 2357899975326
Source 1: NOAA (relative humidity and sunshine hours 1961–1990) [12] [13] [14]
Source 2: Weather Atlas [15]
MonthJanFebMarAprMayJunJulAugSepOctNovDecYear
Record high °F (°C)80
(27)
84
(29)
93
(34)
95
(35)
99
(37)
104
(40)
106
(41)
106
(41)
104
(40)
98
(37)
86
(30)
79
(26)
106
(41)
Mean maximum °F (°C)66.7
(19.3)
68.1
(20.1)
77.3
(25.2)
86.4
(30.2)
91.0
(32.8)
95.7
(35.4)
98.1
(36.7)
96.5
(35.8)
91.9
(33.3)
84.5
(29.2)
74.8
(23.8)
67.1
(19.5)
99.1
(37.3)
Mean daily maximum °F (°C)44.8
(7.1)
48.3
(9.1)
56.5
(13.6)
68.0
(20.0)
76.5
(24.7)
85.1
(29.5)
89.6
(32.0)
87.8
(31.0)
80.7
(27.1)
69.4
(20.8)
58.2
(14.6)
48.8
(9.3)
67.8
(19.9)
Daily mean °F (°C)37.5
(3.1)
40.0
(4.4)
47.6
(8.7)
58.2
(14.6)
67.2
(19.6)
76.3
(24.6)
81.0
(27.2)
79.4
(26.3)
72.4
(22.4)
60.8
(16.0)
49.9
(9.9)
41.7
(5.4)
59.3
(15.2)
Mean daily minimum °F (°C)30.1
(−1.1)
31.8
(−0.1)
38.6
(3.7)
48.4
(9.1)
58.0
(14.4)
67.5
(19.7)
72.4
(22.4)
71.0
(21.7)
64.1
(17.8)
52.2
(11.2)
41.6
(5.3)
34.5
(1.4)
50.9
(10.5)
Mean minimum °F (°C)14.3
(−9.8)
16.9
(−8.4)
23.4
(−4.8)
34.9
(1.6)
45.5
(7.5)
55.7
(13.2)
63.8
(17.7)
62.1
(16.7)
51.3
(10.7)
38.7
(3.7)
28.8
(−1.8)
21.3
(−5.9)
12.3
(−10.9)
Record low °F (°C)−14
(−26)
−15
(−26)
4
(−16)
15
(−9)
33
(1)
43
(6)
52
(11)
49
(9)
36
(2)
26
(−3)
11
(−12)
−13
(−25)
−15
(−26)
Average precipitation inches (mm)2.86
(73)
2.62
(67)
3.50
(89)
3.21
(82)
3.94
(100)
4.20
(107)
4.33
(110)
3.25
(83)
3.93
(100)
3.66
(93)
2.91
(74)
3.41
(87)
41.82
(1,062)
Average snowfall inches (cm)4.9
(12)
5.0
(13)
2.0
(5.1)
0.0
(0.0)
0.0
(0.0)
0.0
(0.0)
0.0
(0.0)
0.0
(0.0)
0.0
(0.0)
0.0
(0.0)
0.1
(0.25)
1.7
(4.3)
13.7
(35)
Average precipitation days (≥ 0.01 in)9.79.311.010.811.610.610.58.78.78.38.410.1117.7
Average snowy days (≥ 0.1 in)2.82.71.10.00.00.00.00.00.00.00.11.38.0
Average relative humidity (%)62.160.558.658.064.565.866.969.369.767.464.764.164.3
Average dew point °F (°C)21.7
(−5.7)
23.5
(−4.7)
31.3
(−0.4)
39.7
(4.3)
52.3
(11.3)
61.5
(16.4)
66.0
(18.9)
65.8
(18.8)
59.5
(15.3)
47.5
(8.6)
37.0
(2.8)
27.1
(−2.7)
44.4
(6.9)
Mean monthly sunshine hours 144.6151.8204.0228.2260.5283.2280.5263.1225.0203.6150.2133.02,527.7
Percent possible sunshine 48505557596462626059504557
Average ultraviolet index 2357899874326
Source 1: NOAA (relative humidity, dew point and sun 1961−1990) [17] [18] [19] [20]
Source 2: Weather Atlas (UV) [21]
Climate data for Dulles International Airport in Sterling, Virginia (1991−2020 normals, [lower-alpha 9] extremes 1960−present)
MonthJanFebMarAprMayJunJulAugSepOctNovDecYear
Record high °F (°C)79
(26)
80
(27)
89
(32)
93
(34)
97
(36)
102
(39)
105
(41)
104
(40)
99
(37)
96
(36)
84
(29)
79
(26)
105
(41)
Mean maximum °F (°C)65.6
(18.7)
67.1
(19.5)
76.5
(24.7)
85.8
(29.9)
89.9
(32.2)
94.1
(34.5)
96.7
(35.9)
95.4
(35.2)
91.3
(32.9)
84.4
(29.1)
74.4
(23.6)
66.1
(18.9)
97.7
(36.5)
Mean daily maximum °F (°C)42.6
(5.9)
46.1
(7.8)
54.8
(12.7)
66.8
(19.3)
75.0
(23.9)
83.1
(28.4)
87.6
(30.9)
86.3
(30.2)
79.3
(26.3)
67.8
(19.9)
56.5
(13.6)
46.5
(8.1)
66.0
(18.9)
Daily mean °F (°C)33.9
(1.1)
36.4
(2.4)
44.2
(6.8)
55.0
(12.8)
64.0
(17.8)
72.5
(22.5)
77.2
(25.1)
75.7
(24.3)
68.6
(20.3)
56.6
(13.7)
46.0
(7.8)
37.7
(3.2)
55.7
(13.2)
Mean daily minimum °F (°C)25.2
(−3.8)
26.7
(−2.9)
33.6
(0.9)
43.2
(6.2)
53.0
(11.7)
61.9
(16.6)
66.8
(19.3)
65.2
(18.4)
57.9
(14.4)
45.3
(7.4)
35.6
(2.0)
29.0
(−1.7)
45.3
(7.4)
Mean minimum °F (°C)6.6
(−14.1)
9.6
(−12.4)
16.8
(−8.4)
27.8
(−2.3)
37.0
(2.8)
48.3
(9.1)
55.4
(13.0)
54.4
(12.4)
43.0
(6.1)
29.9
(−1.2)
20.6
(−6.3)
13.4
(−10.3)
3.8
(−15.7)
Record low °F (°C)−18
(−28)
−14
(−26)
−1
(−18)
17
(−8)
28
(−2)
36
(2)
41
(5)
38
(3)
30
(−1)
15
(−9)
9
(−13)
−4
(−20)
−18
(−28)
Average precipitation inches (mm)2.94
(75)
2.61
(66)
3.50
(89)
3.47
(88)
4.72
(120)
4.30
(109)
4.15
(105)
3.53
(90)
3.94
(100)
3.65
(93)
3.13
(80)
3.30
(84)
43.24
(1,098)
Average snowfall inches (cm)6.9
(18)
7.0
(18)
3.9
(9.9)
0.1
(0.25)
0.0
(0.0)
0.0
(0.0)
0.0
(0.0)
0.0
(0.0)
0.0
(0.0)
0.0
(0.0)
0.3
(0.76)
2.8
(7.1)
21.0
(53)
Average extreme snow depth inches (cm)4.3
(11)
4.3
(11)
2.5
(6.4)
0.0
(0.0)
0.0
(0.0)
0.0
(0.0)
0.0
(0.0)
0.0
(0.0)
0.0
(0.0)
0.0
(0.0)
0.1
(0.25)
1.9
(4.8)
7.5
(19)
Average precipitation days (≥ 0.01 in)10.39.111.011.012.710.811.09.39.08.18.610.2121.1
Average snowy days (≥ 0.1 in)3.12.91.80.10.00.00.00.00.00.00.21.69.7
Average relative humidity (%)68.166.063.962.670.472.373.074.875.473.070.069.669.9
Average dew point °F (°C)20.7
(−6.3)
22.3
(−5.4)
30.2
(−1.0)
38.7
(3.7)
51.4
(10.8)
60.6
(15.9)
64.9
(18.3)
64.0
(17.8)
57.6
(14.2)
45.0
(7.2)
35.1
(1.7)
25.7
(−3.5)
43.0
(6.1)
Source: National Weather Service (relative humidity and dew point 1962–1990) [22] [23] [24]
Climate data for Big Meadows, Virginia (station elevation 3,540ft)
MonthJanFebMarAprMayJunJulAugSepOctNovDecYear
Record high °F (°C)68
(20)
66
(19)
78
(26)
87
(31)
89
(32)
88
(31)
95
(35)
92
(33)
90
(32)
84
(29)
75
(24)
68
(20)
95
(35)
Mean maximum °F (°C)54.5
(12.5)
57.6
(14.2)
66.4
(19.1)
75.8
(24.3)
79.2
(26.2)
83
(28)
84.3
(29.1)
83.4
(28.6)
80.9
(27.2)
73.6
(23.1)
64.9
(18.3)
57.8
(14.3)
84.7
(29.3)
Mean daily maximum °F (°C)36.1
(2.3)
38.3
(3.5)
45.9
(7.7)
56.9
(13.8)
65.5
(18.6)
72.3
(22.4)
75.4
(24.1)
74.1
(23.4)
68.1
(20.1)
58.7
(14.8)
48.0
(8.9)
38.9
(3.8)
56.5
(13.6)
Mean daily minimum °F (°C)18.4
(−7.6)
19.7
(−6.8)
26.3
(−3.2)
35.7
(2.1)
45.5
(7.5)
53.4
(11.9)
57.2
(14.0)
55.9
(13.3)
49.8
(9.9)
39.8
(4.3)
30.4
(−0.9)
21.4
(−5.9)
37.8
(3.2)
Mean minimum °F (°C)−2.2
(−19.0)
−0.8
(−18.2)
6.9
(−13.9)
17.8
(−7.9)
29.4
(−1.4)
39.7
(4.3)
46.2
(7.9)
44
(7)
34.2
(1.2)
23.1
(−4.9)
12.1
(−11.1)
2
(−17)
−6.4
(−21.3)
Record low °F (°C)−29
(−34)
−14
(−26)
−6
(−21)
7
(−14)
18
(−8)
31
(−1)
34
(1)
31
(−1)
25
(−4)
12
(−11)
−1
(−18)
−15
(−26)
−29
(−34)
Average precipitation inches (mm)3.56
(90)
3.06
(78)
4.06
(103)
4.03
(102)
4.73
(120)
4.71
(120)
4.54
(115)
4.88
(124)
5.12
(130)
4.86
(123)
4.35
(110)
3.61
(92)
51.51
(1,308)
Average snowfall inches (cm)10.5
(27)
9.5
(24)
8.4
(21)
1.7
(4.3)
0
(0)
0
(0)
0
(0)
0
(0)
0
(0)
0.7
(1.8)
3.6
(9.1)
6.6
(17)
41.0
(104)
Average precipitation days9810101211121110988118
Average snowy days76410000003528
Source: http://www.wrcc.dri.edu/cgi-bin/cliMAIN.pl?va0720

Severe weather

Thunderstorms are a frequent concern in Virginia. Lightning over Short Hill Mountain.jpg
Thunderstorms are a frequent concern in Virginia.

Severe weather is a concern in Virginia. Hurricanes make the coastal area of Virginia vulnerable. It is rare for a major hurricane to threaten the Virginia coast as hurricanes this far north tend to weaken due to cooler coast waters and increasingly westerly winds aloft. Heavy rain from tropical cyclones remains a concern, however. Hurricane Isabel in 2003 brought much destruction from wind and rain, killing 10 directly and doing nearly two billion dollars in damage. Hurricane Gaston in 2004 inundated Richmond after moving ashore South Carolina. [25] Virginia is often struck with the remnants of systems which hit along the Gulf of Mexico coastline, which also bring torrential rain to the state. Hurricane Camille was an extreme example, bringing 27 inches (690 mm) of rainfall to portions of Nelson County in a matter of hours. [26] Thunderstorms are an occasional concern with the state averaging anywhere from 35 to 45 days of thunderstorm activity annually. [27]

Rainfall in Virginia is frequent, but does not normally get severe enough for floods. Virginia averages seven tornadoes annually, though most are F2 and lower on the Fujita scale. [28] However, Virginia had eighty-five in 2004. [29] Western Virginia has a lower rate of tornadoes. [30]

Climate change

Koppen climate types in Virginia Virginia Koppen.png
Köppen climate types in Virginia

Climate change in Virginia encompasses the effects of climate change, attributed to man-made increases in atmospheric carbon dioxide, in the U.S. state of Virginia.

The United States Environmental Protection Agency reports:

"Virginia's climate is changing. Most of the state has warmed about one degree (F) in the last century, and the sea is rising one to two inches every decade. Higher water levels are eroding beaches, submerging low lands, exacerbating coastal flooding, and increasing the salinity of estuaries and aquifers. The southeastern United States has warmed less than most of the nation. But in the coming decades, the region's changing climate is likely to reduce crop yields, harm livestock, increase the number of unpleasantly hot days, and increase the risk of heat stroke and other heat-related illnesses". [31]

Seasons

Winter in Virginia is characterized by large swings in temperature throughout and between days. This does not happen every day of the month, however. It may be 50°F and windy one morning, and 70°F and calm the next afternoon. In winter, it gets quite cold. Temperatures usually range from the 50s to the high 20s in December; while in January, it can range from the 40s, all the way down to the teens. Snowfall can be moderate, or considerably high during the winter. Almost every year, Virginia receives snow during December, and every year in January-February.

In the summer, temperatures are hot and humid. Precipitation is slightly greater. Temperatures are not extreme, ranging between the high 70s and mid 90s; but humidity can make it feel hotter.

As for sunlight, Virginia is about average in state rankings. [32] Areas on the Chesapeake Coast and Eastern Shore are brightest, while the west and north of the state is more cloudy. On the Winter Solstice, Virginia gets between 9 and 10 hours of sunlight. On the summer solstice, it gets between 14.5 and 15 hours.

See also

Notes

  1. Mean monthly maxima and minima (i.e. the expected highest and lowest temperature readings at any point during the year or given month) calculated based on data at said location from 1991 to 2020.
  2. Official records for Lynchburg were kept at the Weather Bureau Office from January 1893 to July 1944, and at Lynchburg Regional since August 1944. For more information, see ThreadEx
  3. Mean monthly maxima and minima (i.e. the expected highest and lowest temperature readings at any point during the year or given month) calculated based on data at said location from 1991 to 2020.
  4. Official records for Norfolk kept January 1874 to December 1945 at the Weather Bureau Office in downtown, and at Norfolk Int'l since January 1946. For more information, see Threadex.
  5. Mean monthly maxima and minima (i.e. the expected highest and lowest temperature readings at any point during the year or given month) calculated based on data at said location from 1991 to 2020.
  6. Official records for Richmond kept January 1887 to December 1910 at downtown, Chimborazo Park from January 1911 to December 1929, and at Richmond Int'l since January 1930. For more information, see Threadex
  7. Mean monthly maxima and minima (i.e. the expected highest and lowest temperature readings at any point during the year or given month) calculated based on data at said location from 1991 to 2020.
  8. Official records for Washington, D.C. were kept at 24th and M Streets NW from January 1872 to June 1945, and at Reagan National Airport since July 1945. [16]
  9. Mean monthly maxima and minima (i.e. the expected highest and lowest temperature readings at any point during the year or given month) calculated based on data at said location from 1991 to 2020.

Related Research Articles

<span class="mw-page-title-main">Climate of Missouri</span> Overview of the climate of Missouri, United States

Missouri generally has a variety of seasonal humid subtropical climate, with cool winters and long, hot summers. In the southern part of the state, particularly in the Bootheel, the climate borders on a more mild-type humid subtropical climate, and in the northern third, the state transitions into a humid continental climate. Because of its location in the interior United States, Missouri often experiences extremes in temperatures. Lacking either large mountains or oceans nearby to moderate its temperature, its climate is alternately influenced by air from the cold Arctic and the hot and humid Gulf of Mexico.

Quillayute Airport, formerly known as Quillayute State Airport, is a public airport located approximately 10 miles (16 km) west of the city of Forks, in Clallam County, Washington, United States. It is owned by the City of Forks. This former Naval Auxiliary Air Station was deeded to the City of Forks by the Washington State Department of Transportation in 1999.

Milwaukee has a humid continental climate, with four distinct seasons and wide variations in temperature and precipitation in short periods of time. The city's climate is also strongly influenced by nearby Lake Michigan, which creates two varying climates within the Milwaukee area. The Urban heat island effect also plays a role in the city's climate, insulating it from winter cold, but keeping it cooler in spring and summer.

Oklahoma City lies in a temperate humid subtropical climate, with frequent variations in weather daily and seasonally, except during the consistently hot and humid summer months. Consistent winds, usually from the south or south-southeast during the summer, help temper the hotter weather. Consistent northerly winds during the winter can intensify cold periods. Oklahoma City's climate transitions toward semi-arid further to the west, toward humid continental to the north, and toward humid subtropical to the east and southeast. The normal annual mean temperature is 61.4 °F (16.3 °C); the coolest year was 1895 with a mean of 57.9 °F (14.4 °C), while the warmest 2012 at 64.1 °F (17.8 °C). Precipitation averages 36.52 inches (928 mm) annually, falling on an average 84 days, with the warmer months receiving more; annual precipitation has historically ranged from 15.74 in (400 mm) in 1901 to 56.95 in (1,447 mm) in 2007. The sun shines about 69% of the time, with monthly percent possible sunshine ranging from 60% in December to 80% in July.

<span class="mw-page-title-main">Climate of California</span> Overview of the climate of the U.S. state of California

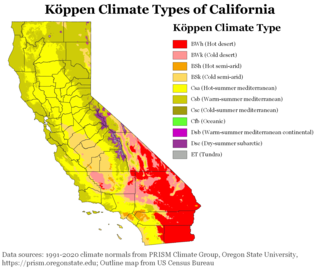
The climate of California varies widely from hot desert to alpine tundra, depending on latitude, elevation, and proximity to the Pacific Coast. California's coastal regions, the Sierra Nevada foothills, and much of the Central Valley have a Mediterranean climate, with warmer, drier weather in summer and cooler, wetter weather in winter. The influence of the ocean generally moderates temperature extremes, creating warmer winters and substantially cooler summers in coastal areas.

Columbus, Ohio has a humid continental climate, characterized by humid, hot summers and cold winters, with no dry season. The Dfa climate has average temperatures above 22 °C during the warmest months, with at least four months averaging above 10 °C, and below 0 °C during the coldest. The climate is transitional with the Cfa humid subtropical climate to the south, characterized by humid, hot summers and cool winters.

<span class="mw-page-title-main">Climate of North Dakota</span>

North Dakota's climate is typical of a continental climate with cold winters and warm-hot summers. The state's location in the Upper Midwest allows it to experience some of the widest variety of weather in the United States, and each of the four seasons has its own distinct characteristics. The eastern half of the state has a humid continental climate with warm to hot, somewhat humid summers and cold, windy winters, while the western half has a semi-arid climate with less precipitation and less humidity but similar temperature profiles. The areas east of the Missouri River get slightly colder winters, while those west of the stream get higher summer daytime temperatures. In general, the diurnal temperature difference is prone to be more significant in the west due to higher elevation and less humidity.

<span class="mw-page-title-main">Climate of Georgia (U.S. state)</span> Overview of the climate of the U.S. state of Georgia

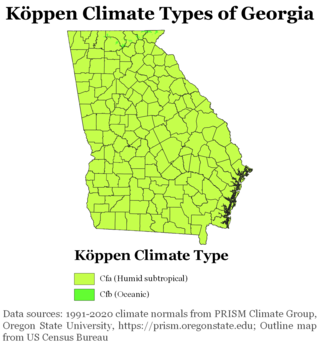
The climate of Georgia is a humid subtropical climate, with most of the state having short, mild winters and long, hot summers. The Atlantic Ocean on the east coast of Georgia and the hill country in the north impact the state's climate. Also, the Chattahoochee River divides Georgia into separate climatic regions with the mountain region to the northwest being cooler than the rest of the state; the average temperatures for the mountain region in January and July are 39 °F (4 °C) and 78 °F (26 °C) respectively. Winter in Georgia is characterized by mild temperatures and little snowfall around the state, with the potential for snow and ice increasing in the northern parts of the state. Summer daytime temperatures in Georgia often exceed 95 °F (35 °C). The state experiences widespread precipitation. Tornadoes and tropical cyclones are common.

<span class="mw-page-title-main">Climate of Pennsylvania</span> Overview of the climate of the U.S. state of Pennsylvania

The climate of Pennsylvania is diverse due to the multitude of geographic features found within the state. Straddling two major climate zones, the southeastern corner of Pennsylvania has the warmest climate. A portion of Greater Philadelphia lies at the southernmost tip of the humid continental climate zone, with the city proper being in the humid subtropical climate zone. Still, Philadelphia features colder, snowier winters than most locations with a humid subtropical climate. Moving west toward the mountainous interior of the state, the climate becomes markedly colder, the number of cloudy days increases, and winter snowfall amounts are greater.

<span class="mw-page-title-main">Climate of Anchorage</span>

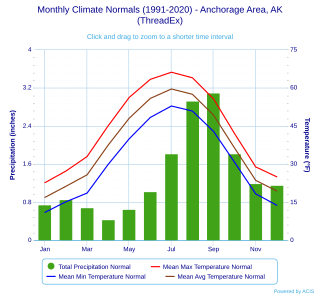
Anchorage, Alaska has a subarctic climate with the code Dfc according to the Köppen climate classification due to its short, cool summers. The weather on any given day is very unpredictable. Some winters feature several feet of snow and cold temperatures, while the summers are typically mild but are cool compared to the contiguous US and interior Alaska. Because of Anchorage's high latitude, summer days are very long and winter daylight hours are very short. The longest day of sunlight being 18hrs and 21 minutes, and shortest being 5 hours and 28 minutes. Anchorage is often cloudy during the winter, which decreases the amount of sunlight experienced by residents.

<span class="mw-page-title-main">Climate of South Carolina</span> Overview of the climate of the U.S. state of South Carolina

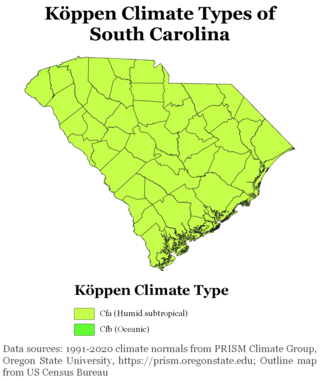
South Carolina has a humid subtropical climate, with hot summers throughout most of the state. But, an exception does occur in the Blue Ridge Mountains, as outlier pockets of an Oceanic Climate do exist. Mild winters predominate in the eastern and southern part of the state, but cool to occasionally cold winters are the standard in the northwestern area of the state, especially areas at or above 600 feet in elevation. On average, between 40 and 80 inches of precipitation falls annually across the state, potentially even in excess of 100 inches in portions of the Appalachian temperate rainforest. Tropical cyclones, and afternoon thunderstorms due to hot and humid conditions, contribute to precipitation during the summer and sometimes fall months, while extratropical cyclones contribute to precipitation during the fall, winter, and spring months. The coast experiences nearly all of their tropical weather impacts from storms coming directly from the Atlantic coast. The northwestern area of the state can receive impacts from both Atlantic basin storms moving westward from the coast and also occasionally very heavy rainfall and flooding from storms originating from the Gulf of Mexico that move inland towards the northeast after making landfall from the Florida Panhandle to Louisiana.

<span class="mw-page-title-main">Geography of Nevada</span>

The landlocked U.S. state of Nevada has a varied geography and is almost entirely within the Basin and Range Province and is broken up by many north–south mountain ranges. Most of these ranges have endorheic valleys between them.

<span class="mw-page-title-main">Geography of Kansas</span> Overview of the Geography of Kansas

The U.S. state of Kansas is bordered by Nebraska to the north; Missouri to the east; Oklahoma to the south; and Colorado to the west. The state is divided into 105 counties with 628 cities, with its largest county by area being Butler County. Kansas is located equidistant from the Pacific and Atlantic oceans. The geographic center of the 48 contiguous states is in Smith County near Lebanon. Until 1989, the Meades Ranch Triangulation Station in Osborne County was the geodetic center of North America: the central reference point for all maps of North America. The geographic center of Kansas is in Barton County.

<span class="mw-page-title-main">Geography of Michigan</span> Aspect of geography

Michigan consists of two peninsulas surrounded primarily by four of the Great Lakes and a variety of nearby islands. The Upper Peninsula is bounded on the southwest by Wisconsin, and the Lower Peninsula is bounded on the south by Indiana and Ohio. Both land masses are also separated from the Canadian province of Ontario by waterways of the Great Lakes, and from each other by the Straits of Mackinac. Because its land is largely surrounded by the Great Lakes, which flow into the Saint Lawrence River, Michigan is the only U.S. state whose streams and rivers are almost entirely within the Great Lakes-St. Lawrence watershed.

<span class="mw-page-title-main">Climate of New York (state)</span> Overview of the climate of the U.S. state of New York

The climate of New York (state) is generally humid continental, while the extreme southeastern portion of the state lies in the warmer humid subtropical climate zone. Winter temperatures average below freezing during January and February in much of the state of New York, but several degrees above freezing along the Atlantic coastline, including New York City.

<span class="mw-page-title-main">Climate of Massachusetts</span> Overview of the climate of Massachusetts

The climate of Massachusetts is mainly a humid continental climate, with hot, humid summers and cold, snowy winters and abundant precipitation. Massachusetts is a state located in the New England region of the northeastern United States. Most of its population of 7.0 million live in the Boston metropolitan area. The eastern half of this relatively small state is mostly urban and suburban. Massachusetts is the most populous of the six New England states and ranks third in the nation by population density and fourth by GDP per capita. Massachusetts receives about 43 inches or 1,090 millimetres of rain annually, fairly evenly distributed throughout the year, slightly wetter during the winter. Summers are warm with average high temperatures in July above 80 °F or 26.7 °C and overnight lows above 60 °F or 15.6 °C common throughout the state. Winters are cold, but generally less extreme on the coast with high temperatures in the winter averaging above freezing even in January, although areas further inland are much colder. The state does have extreme temperatures from time to time with 100 °F or 37.8 °C in the summer and temperatures below 0 °F or −17.8 °C in the winter not being unusual.

<span class="mw-page-title-main">Climate of Miami</span> Overview of the climate of Miami

The climate of Miami is classified as having a tropical monsoon climate with hot and humid summers; short, warm winters; and a marked drier season in the winter. Its sea-level elevation, coastal location, position just above the Tropic of Cancer, and proximity to the Gulf Stream shape its climate.

<span class="mw-page-title-main">Climate of New Jersey</span> Overview of the climate of the U.S. state of New Jersey

The climate of New Jersey classification of the U.S. state of New Jersey is humid subtropical in South Jersey with a humid continental climate in North Jersey, particularly in the northwestern area of the state. The northwest part of New Jersey is the snowiest due to the higher elevations that earn it a Dfb classification. During the winters, New Jersey can experience Nor'easters, which are snowstorms that affect the Northeastern United States, and Atlantic Canada. However, many would-be snow events in the state end up turning to rain due to warm ocean air being brought in by the storm. New Jersey's climate is shaped by its proximity to the Atlantic Ocean which provides moisture and moderates temperatures. According to climatology research by the U.S. National Oceanic and Atmospheric Administration, New Jersey has been the fastest-warming state by average air temperature over a 100-year period beginning in the early 20th century, related to global warming.

<span class="mw-page-title-main">Climate of New England</span> Overview of the climate of New England

The climate of New England varies greatly across its 500-mile (800 km) span from northern Maine to southern Connecticut.

<span class="mw-page-title-main">Climate of Little Rock, Arkansas</span>

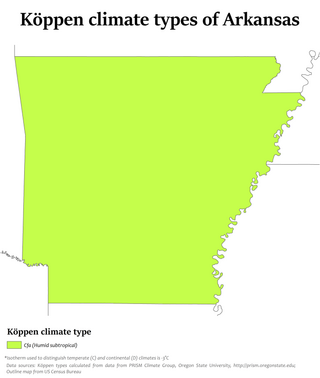
Little Rock has a humid subtropical climate, with hot, usually humid summers, but subject to drought, primarily in late summer. According to the Trewartha climate classification system, Little Rock is subtropical because nine of its months exceed 50 °F (10 °C) in average temperature. Summers are usually hot, occasionally extremely hot; winters are short and cool, but with marked temperature variations, as the area is subject to alternating incursions of warm, moist air from the Gulf of Mexico and cold, dry air from Canada.

References

  1. "World Map of Köppen−Geiger Climate Classification" (PDF). Archived from the original (PDF) on January 14, 2009. Retrieved 2008-12-19.
  2. Shell, Eddie Wayne (2013). Evolution of the Alabama Agroecosystem: Always Keeping Up, but Never Catching Up. NewSouth Books. ISBN   978-1-60306-203-9.
  3. "Climate of Virginia". Charles A. Grymes. Archived from the original on 2007-10-06. Retrieved 2007-07-30.
  4. "Virginia Extremes". climate.virginia.edu. Retrieved 2017-02-04.
  5. "NowData – NOAA Online Weather Data". National Oceanic and Atmospheric Administration. Retrieved July 2, 2021.
  6. "Station: Lynchburg RGNL AP, VA". U.S. Climate Normals 2020: U.S. Monthly Climate Normals (1991-2020). National Oceanic and Atmospheric Administration. Retrieved July 2, 2021.
  7. "WMO Climate Normals for LYNCHBURG WSO AP, VA 1961–1990". National Oceanic and Atmospheric Administration. Retrieved March 11, 2014.
  8. "NowData – NOAA Online Weather Data". National Oceanic and Atmospheric Administration. Retrieved May 18, 2021.
  9. "Station: NORFOLK INTL AP, VA". U.S. Climate Normals 2020: U.S. Monthly Climate Normals (1991–2020). National Oceanic and Atmospheric Administration. Retrieved May 18, 2021.
  10. "WMO Climate Normals for NORFOLK/INTL, VA 1961–1990". National Oceanic and Atmospheric Administration. Retrieved July 29, 2020.
  11. "Norfolk, Virginia, USA - Monthly weather forecast and Climate data". Weather Atlas. Retrieved July 3, 2019.
  12. "NowData – NOAA Online Weather Data". National Oceanic and Atmospheric Administration. Archived from the original on September 5, 2015. Retrieved May 4, 2021.
  13. "Summary of Monthly Normals 1991–2020". National Oceanic and Atmospheric Administration. Archived from the original on May 5, 2021. Retrieved May 4, 2021.
  14. "WMO Climate Normals for Richmond/Byrd, VA 1961–1990". National Oceanic and Atmospheric Administration. Archived from the original on 2024-02-16. Retrieved 2020-07-29.
  15. "Richmond, VA - Detailed climate information and monthly weather forecast". Weather Atlas. Yu Media Group. Archived from the original on June 29, 2019. Retrieved June 29, 2019.
  16. "Threaded Station Extremes". threadex.rcc-acis.org.
  17. "NowData – NOAA Online Weather Data". National Oceanic and Atmospheric Administration . Retrieved May 24, 2021.
  18. "Summary of Monthly Normals 1991–2020". National Oceanic and Atmospheric Administration. Retrieved May 4, 2021.
  19. "WMO Climate Normals for WASHINGTON DC/NATIONAL ARPT VA 1961–1990". National Oceanic and Atmospheric Administration. Retrieved July 18, 2020.
  20. Rogers, Matt (1 April 2015). "April outlook: Winter be gone! First half of month looks warmer than average". The Washington Post . Retrieved May 24, 2021. For reference, here are the 30-year climatology benchmarks for Reagan National Airport for April, along with our projections for the coming month:...Average snowfall: Trace; Forecast: 0 to trace
  21. "Washington, DC - Detailed climate information and monthly weather forecast". Weather Atlas. Yu Media Group. Retrieved June 29, 2019.
  22. "NowData – NOAA Online Weather Data". National Oceanic and Atmospheric Administration. Retrieved July 5, 2021.
  23. "Station: Washington DC DULLES AP, VA". U.S. Climate Normals 2020: U.S. Monthly Climate Normals (1991–2020). National Oceanic and Atmospheric Administration. Retrieved July 5, 2021.
  24. "WMO Climate Normals for WASHINGTON DC/DULLES INT'L AR, VA 1961–1990". National Oceanic and Atmospheric Administration. Retrieved May 4, 2015.
  25. David M. Roth. Hurricane Gaston Rainfall Graphic. Hydrometeorological Prediction Center. Retrieved on 2008-01-13.
  26. David M. Roth. Hurricane Camille Rainfall Page. Hydrometeorological Prediction Center. Retrieved on 2008-01-13.
  27. "History: Thunderstorms & Lightning". Virginia Department of Emergency Management. Archived from the original on 5 March 2017. Retrieved 4 March 2017.
  28. Ricketts, Lauryn (February 7, 2008). "Tornadoes DO happen in Virginia!". TV3 Winchester. Archived from the original on March 14, 2010. Retrieved 2009-02-13.
  29. "Natural Hazards : Tornadoes". Virginia Business Emergency Survival Toolkit. 2007. Archived from the original on 2007-07-05. Retrieved 2007-11-29.
  30. "Tornado History Project: Virginia". www.tornadohistoryproject.com. Retrieved 2017-02-03.
  31. "What Climate Change Means for Virginia" (PDF). United States Environmental Protection Agency. August 2016.
  32. "Sunniest States 2021".