Bioimage informatics

Last updated

Bioimage informatics is a subfield of bioinformatics and computational biology. [1] It focuses on the use of computational techniques to analyze bioimages, especially cellular and molecular images, at large scale and high throughput. The goal is to obtain useful knowledge out of complicated and heterogeneous image and related metadata.

Contents

Automated microscopes are able to collect large numbers of images with minimal intervention. This has led to a data explosion, which absolutely requires automatic processing. Additionally, and surprisingly, for several of these tasks, there is evidence that automated systems can perform better than humans. [2] [3] In addition, automated systems are unbiased, unlike human based analysis whose evaluation may (even unconsciously) be influenced by the desired outcome.

There has been an increasing focus on developing novel image processing, computer vision, data mining, database and visualization techniques to extract, compare, search and manage the biological knowledge in these data-intensive problems. [4] [5]

Data Modalities

Several data collection systems and platforms are used, which require different methods to be handled optimally.

Fluorescent Microscopy

Fluorescent image of a cell in telophase. Multiple dyes were imaged and are shown in different colours. TelophaseIF.jpg
Fluorescent image of a cell in telophase. Multiple dyes were imaged and are shown in different colours.

Fluorescent microscopy allows the direct visualization of molecules at the subcellular level, in both live and fixed cells. Molecules of interest are marked with either green fluorescent protein (GFP), another fluorescent protein, or a fluorescently-labeled antibody. Several types of microscope are regularly used: widefield, confocal, or two-photon. Most microscopy system will also support the collection of time-series (movies).

In general, filters are used so that each dye is imaged separately (for example, a blue filter is used to image Hoechst, then rapidly switched to a green filter to image GFP). For consumption, the images are often displayed in false color by showing each channel in a different color, but these may not even be related to the original wavelengths used. In some cases, the original image could even have been acquired in non-visible wavelengths (infrared is common).

The choices at the image acquisition stage will influence the analysis and often require special processing. Confocal stacks will require 3D processing and widefield pseudo-stacks will often benefit from digital deconvolution to remove the out-of-focus light.

The advent of automated microscopes that can acquire many images automatically is one of the reasons why analysis cannot be done by eye (otherwise, annotation would rapidly become the research bottleneck). Using automated microscopes means that some images might be out-of-focus (automated focus finding systems may sometimes be incorrect), contain a small number of cells, or be filled with debris. Therefore, the images generated will be harder to analyse than images acquired by an operator as they would have chosen other locations to image and focus correctly. On the other hand, the operator might introduce an unconscious bias in his selection by choosing only the cells whose phenotype is most like the one expected before the experiment.

Histology

A histology image of alveolar microlithiasis Alveolar microlithiasis 2.jpg
A histology image of alveolar microlithiasis

Histology is a microscopy application where tissue slices are stained and observed under the microscope (typically light microscope, but electron microscopy is also used).

When using a light microscope, unlike the case of fluorescent imaging, images are typically acquired using standard color camera-systems. This reflects partially the history of the field, where humans were often interpreting the images, but also the fact that the sample can be illuminated with white light and all light collected rather than having to excite fluorophores. When more than one dye is used, a necessary preprocessing step is to unmix the channels and recover an estimate of the pure dye-specific intensities.

It has been shown that the subcellular location of stained proteins can be identified from histology images.

If the goal is a medical diagnostic, then histology applications will often fall into the realm of digital pathology or automated tissue image analysis, which are sister fields of bioimage informatics. The same computational techniques are often applicable, but the goals are medically- rather than research-oriented.

Important Problems

Subcellular Location Analysis

Subcellular Location Example. Examples of different patterns are mapped into a two-dimensional space by computing different image features. Image of unknown proteins are similarly mapped into this space and a nearest neighbor search or other classifier can be used for assigning a location to this unclassified protein. SubcellularLocationClassification.png
Subcellular Location Example. Examples of different patterns are mapped into a two-dimensional space by computing different image features. Image of unknown proteins are similarly mapped into this space and a nearest neighbor search or other classifier can be used for assigning a location to this unclassified protein.

Subcellular location analysis was one of the initial problems in this field. In its supervised mode, the problem is to learn a classifier that can recognize images from the major cell organelles based on images.

Methods used are based on machine learning, building a discriminative classifier based on numeric features computed from the image. Features are either generic features from computer vision, such as Haralick texture features or features specially designed to capture biological factors (e.g., co-localization with a nuclear marker being a typical example).

For the basic problem of identifying organelles, very high accuracy values can be obtained, including better than ? results. [2] These methods are useful in basic cell biology research, but have also been applied to the discovery of proteins whose location changes in cancer cells. [6]

However, classification into organelles is a limited form of the problem as many proteins will localize to multiple locations simultaneously (mixed patterns) and many patterns can be distinguished even though they are not different membrane-bound components. There are several unsolved problems in this area and research is ongoing.

High-Content Screening

An automated confocal image reader Automated confocal image reader.jpg
An automated confocal image reader

High throughput screens using automated imaging technology (sometimes called high-content screening) have become a standard method for both drug discovery and basic biological research. Using multi-well plates, robotics, and automated microscopy, the same assay can be applied to a large library of possible reagents (typically either small molecules or RNAi) very rapidly, obtaining thousands of images in a short amount of time. Due to the high volume of data generated, automatic image analysis is a necessity. [7]

When positive and negative controls are available, the problem can be approached as a classification problem and the same techniques of feature computation and classification that are used for subcellular location analysis can be applied.

Segmentation

Example image for segmentation problem. Shown are nuclei of mouse NIH 3T3, stained with Hoechst and a segmentation in red. Gnf-segmented-41-closeup.png
Example image for segmentation problem. Shown are nuclei of mouse NIH 3T3, stained with Hoechst and a segmentation in red.

Segmentation of cells is an important sub-problem in many of the fields below (and sometimes useful on its own if the goal is only to obtain a cell count in a viability assay). The goal is to identify the boundaries of cells in a multi-cell image. This allows for processing each cell individually to measure parameters. In 3D data, segmentation must be performed in 3D space.

As the imaging of a nuclear marker is common across many images, a widely used protocol is to segment the nuclei. This can be useful by itself if nuclear measurements are needed or it can serve to seed a watershed which extends the segmentation to the whole image.

All major segmentation methods have been reported on cell images, from simple thresholding to level set methods. Because there are multiple image modalities and different cell types, each of which implies different tradeoffs, there is no single accepted solution for this problem.

Cell image segmentation as an important procedure is often used to study gene expression and colocalization relationship etc. of individual cells. In such cases of single-cell analysis it is often needed to uniquely determine the identities of cells while segmenting the cells. Such a recognition task is often non-trivial computationally. For model organisms such as C. elegans that have well-defined cell lineages, it is possible to explicitly recognize the cell identities via image analysis, by combining both image segmentation and pattern recognition methods. [9] Simultaneous segmentation and recognition of cells [10] has also been proposed as a more accurate solution for this problem when an "atlas" or other prior information of cells is available. Since gene expression at single cell resolution can be obtained using these types of imaging based approaches, it is possible to combine these methods with other single cell gene expression quantification methods such as RNAseq.

Tracking

Tracking is another traditional image processing problem which appears in bioimage informatics. The problem is to relate objects that appear in subsequent frames of a film. As with segmentation, the problem can be posed in both two- and three-dimensional forms. [11]

In the case of fluorescent imaging, tracking must often be performed on very low contrast images. As obtaining high contrast is done by shining more light which damages the sample and destroys the dye, illumination is kept at a minimum. It is often useful to think of a photon budget: the number of photons that can be used for imaging before the damage to the sample is so great that data can no longer be trusted. Therefore, if high contrast images are to be obtained, then only a few frames can be used; while for long movies, each frame will be of very low contrast.

Registration

When image data samples of different natures, such as those corresponding to different labeling methods, different individuals, samples at different time points, etc. are considered, images often need to be registered for better comparison. One example is as time-course data is collected, images in subsequent frames must often be registered so that minor shifts in the camera position can be corrected for. Another example is that when many images of a model animal (e.g. C. elegans or Drosophila brain or a mouse brain) are collected, there is often a substantial need to register these images to compare their patterns (e.g. those correspond to the same or different neuron population, those share or differ in the gene expression, etc.).

Medical image registration software packages were early attempts to be used for the microscopic image registration applications. However, due to the often much larger image file size and a much bigger number of specimens in the experiments, in many cases it is needed to develop new 3D image registration software.BrainAligner [12] is software that has been used to automate the 3D deformable and nonlinear registration process using a reliable-landmark-matching strategy. It has been primarily used to generate more than 50,000 3D standardized fruitfly brain images at Janelia Farm of HHMI, with other applications including dragonfly and mice.

Important Venues

A consortium of scientists from universities and research institutes have organized annual meetings on bioimage informatics [13] since 2005. The ISMB conference has had a Bioimaging & Data Visualization track since 2010. The journal Bioinformatics also introduced a Bioimage Informatics track in 2012. The OpenAccess journal BMC Bioinformatics has a section devoted to bioimage analysis, visualization and related applications. Other computational biology and bioinformatics journals also regularly publish bioimage informatics work. A European Union Cost action called NEUBIAS (network of european bioimage analysts) has been organizing annual conferences as well as bioimage analyst training schools and taggathons since 2017.

Software

There are several packages that make bioimage informatics methods available through a graphical user interface such as ImageJ, FIJI, CellProfiler, chunkflow or Icy. Visualization and analysis platforms such as Vaa3D have appeared in recent years and have been used in both large scale projects especially for neuroscience and desktop applications.

Example of a fly brain rendered with its compartments' surface models using Vaa3D V3d-display 01.png
Example of a fly brain rendered with its compartments' surface models using Vaa3D

Other researchers develop their own methods, typically based on a programming language with good computer vision support such as Python, C++, or MATLAB. The Mahotas library for Python is one popular example. Although, examples of researcher developed methods in programming languages with less computer vision support as R exist (e.g. trackdem [14] ).

See also

Related Research Articles

<span class="mw-page-title-main">Bioinformatics</span> Computational analysis of large, complex sets of biological data

Bioinformatics is an interdisciplinary field of science that develops methods and software tools for understanding biological data, especially when the data sets are large and complex. Bioinformatics uses biology, chemistry, physics, computer science, computer programming, information engineering, mathematics and statistics to analyze and interpret biological data. The subsequent process of analyzing and interpreting data is referred to as computational biology.

<span class="mw-page-title-main">Volume rendering</span> Representing a 3D-modeled object or dataset as a 2D projection

In scientific visualization and computer graphics, volume rendering is a set of techniques used to display a 2D projection of a 3D discretely sampled data set, typically a 3D scalar field.

<span class="mw-page-title-main">Fluorescence microscope</span> Optical microscope that uses fluorescence and phosphorescence

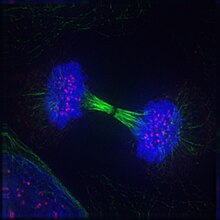
A fluorescence microscope is an optical microscope that uses fluorescence instead of, or in addition to, scattering, reflection, and attenuation or absorption, to study the properties of organic or inorganic substances. "Fluorescence microscope" refers to any microscope that uses fluorescence to generate an image, whether it is a simple set up like an epifluorescence microscope or a more complicated design such as a confocal microscope, which uses optical sectioning to get better resolution of the fluorescence image.

<span class="mw-page-title-main">Confocal microscopy</span> Optical imaging technique

Confocal microscopy, most frequently confocal laser scanning microscopy (CLSM) or laser scanning confocal microscopy (LSCM), is an optical imaging technique for increasing optical resolution and contrast of a micrograph by means of using a spatial pinhole to block out-of-focus light in image formation. Capturing multiple two-dimensional images at different depths in a sample enables the reconstruction of three-dimensional structures within an object. This technique is used extensively in the scientific and industrial communities and typical applications are in life sciences, semiconductor inspection and materials science.

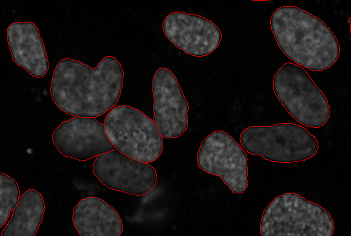
CellProfiler is free, open-source software designed to enable biologists without training in computer vision or programming to quantitatively measure phenotypes from thousands of images automatically. Advanced algorithms for image analysis are available as individual modules that can be placed in sequential order together to form a pipeline; the pipeline is then used to identify and measure biological objects and features in images, particularly those obtained through fluorescence microscopy.

High-content screening (HCS), also known as high-content analysis (HCA) or cellomics, is a method that is used in biological research and drug discovery to identify substances such as small molecules, peptides, or RNAi that alter the phenotype of a cell in a desired manner. Hence high content screening is a type of phenotypic screen conducted in cells involving the analysis of whole cells or components of cells with simultaneous readout of several parameters. HCS is related to high-throughput screening (HTS), in which thousands of compounds are tested in parallel for their activity in one or more biological assays, but involves assays of more complex cellular phenotypes as outputs. Phenotypic changes may include increases or decreases in the production of cellular products such as proteins and/or changes in the morphology of the cell. Hence HCA typically involves automated microscopy and image analysis. Unlike high-content analysis, high-content screening implies a level of throughput which is why the term "screening" differentiates HCS from HCA, which may be high in content but low in throughput.

Neuromorphology is the study of nervous system form, shape, and structure. The study involves looking at a particular part of the nervous system from a molecular and cellular level and connecting it to a physiological and anatomical point of view. The field also explores the communications and interactions within and between each specialized section of the nervous system. Morphology is distinct from morphogenesis. Morphology is the study of the shape and structure of biological organisms, while morphogenesis is the study of the biological development of the shape and structure of organisms. Therefore, neuromorphology focuses on the specifics of the structure of the nervous system and not the process by which the structure was developed. Neuromorphology and morphogenesis, while two different entities, are nonetheless closely linked.

<span class="mw-page-title-main">Fiji (software)</span> Open-source image-processing software

Fiji is an open source image processing package based on ImageJ2.

<span class="mw-page-title-main">Vertico spatially modulated illumination</span>

Vertico spatially modulated illumination (Vertico-SMI) is the fastest light microscope for the 3D analysis of complete cells in the nanometer range. It is based on two technologies developed in 1996, SMI and SPDM. The effective optical resolution of this optical nanoscope has reached the vicinity of 5 nm in 2D and 40 nm in 3D, greatly surpassing the λ/2 resolution limit applying to standard microscopy using transmission or reflection of natural light according to the Abbe resolution limit That limit had been determined by Ernst Abbe in 1873 and governs the achievable resolution limit of microscopes using conventional techniques.

Biology data visualization is a branch of bioinformatics concerned with the application of computer graphics, scientific visualization, and information visualization to different areas of the life sciences. This includes visualization of sequences, genomes, alignments, phylogenies, macromolecular structures, systems biology, microscopy, and magnetic resonance imaging data. Software tools used for visualizing biological data range from simple, standalone programs to complex, integrated systems.

<span class="mw-page-title-main">Time-lapse microscopy</span> Type of microscopy

Time-lapse microscopy is time-lapse photography applied to microscopy. Microscope image sequences are recorded and then viewed at a greater speed to give an accelerated view of the microscopic process.

<span class="mw-page-title-main">Intravital microscopy</span> Imaging of cells in living animals

Intravital microscopy is a form of microscopy that allows observing biological processes in live animals at a high resolution that makes distinguishing between individual cells of a tissue possible.

<span class="mw-page-title-main">Cytometry</span> Measurement of number and characteristics of cells

Cytometry is the measurement of number and characteristics of cells. Variables that can be measured by cytometric methods include cell size, cell count, cell morphology, cell cycle phase, DNA content, and the existence or absence of specific proteins on the cell surface or in the cytoplasm. Cytometry is used to characterize and count blood cells in common blood tests such as the complete blood count. In a similar fashion, cytometry is also used in cell biology research and in medical diagnostics to characterize cells in a wide range of applications associated with diseases such as cancer and AIDS.

Super-resolution microscopy is a series of techniques in optical microscopy that allow such images to have resolutions higher than those imposed by the diffraction limit, which is due to the diffraction of light. Super-resolution imaging techniques rely on the near-field or on the far-field. Among techniques that rely on the latter are those that improve the resolution only modestly beyond the diffraction-limit, such as confocal microscopy with closed pinhole or aided by computational methods such as deconvolution or detector-based pixel reassignment, the 4Pi microscope, and structured-illumination microscopy technologies such as SIM and SMI.

Serial block-face scanning electron microscopy is a method to generate high resolution three-dimensional images from small samples. The technique was developed for brain tissue, but it is widely applicable for any biological samples. A serial block-face scanning electron microscope consists of an ultramicrotome mounted inside the vacuum chamber of a scanning electron microscope. Samples are prepared by methods similar to that in transmission electron microscopy (TEM), typically by fixing the sample with aldehyde, staining with heavy metals such as osmium and uranium then embedding in an epoxy resin. The surface of the block of resin-embedded sample is imaged by detection of back-scattered electrons. Following imaging the ultramicrotome is used to cut a thin section from the face of the block. After the section is cut, the sample block is raised back to the focal plane and imaged again. This sequence of sample imaging, section cutting and block raising can acquire many thousands of images in perfect alignment in an automated fashion. Practical serial block-face scanning electron microscopy was invented in 2004 by Winfried Denk at the Max-Planck-Institute in Heidelberg and is commercially available from Gatan Inc., Thermo Fisher Scientific (VolumeScope) and ConnectomX.

<span class="mw-page-title-main">Robert F. Murphy (computational biologist)</span>

Robert F. Murphy is Ray and Stephanie Lane Professor of Computational Biology Emeritus and Director of the M.S. Program in Automated Science at Carnegie Mellon University. Prior to his retirement in May 2021, he was the Ray and Stephanie Lane Professor of Computational Biology as well as Professor of Biological Sciences, Biomedical Engineering, and Machine Learning. He was founding Director of the Center for Bioimage Informatics at Carnegie Mellon and founded the Joint CMU-Pitt Ph.D. Program in Computational Biology. He also founded the Computational Biology Department at Carnegie Mellon University and served as its head from 2009 to 2020.

<span class="mw-page-title-main">Amira (software)</span> Software platform for 3D and 4D data visualization

Amira is a software platform for visualization, processing, and analysis of 3D and 4D data. It is being actively developed by Thermo Fisher Scientific in collaboration with the Zuse Institute Berlin (ZIB), and commercially distributed by Thermo Fisher Scientific — together with its sister software Avizo.

CytoViva, Inc. is a scientific imaging and instrumentation company that develops and markets optical microscopy and hyperspectral imaging technology for nanomaterials, pathogen and general biology applications.

Neuronal tracing, or neuron reconstruction is a technique used in neuroscience to determine the pathway of the neurites or neuronal processes, the axons and dendrites, of a neuron. From a sample preparation point of view, it may refer to some of the following as well as other genetic neuron labeling techniques,

Vaa3D is an Open Source visualization and analysis software suite created mainly by Hanchuan Peng and his team at Janelia Research Campus, HHMI and Allen Institute for Brain Science. The software performs 3D, 4D and 5D rendering and analysis of very large image data sets, especially those generated using various modern microscopy methods, and associated 3D surface objects. This software has been used in several large neuroscience initiatives and a number of applications in other domains. In a recent Nature Methods review article, it has been viewed as one of the leading open-source software suites in the related research fields. In addition, research using this software was awarded the 2012 Cozzarelli Prize from the National Academy of Sciences.

References

  1. Peng, H; Bateman A; Valencia A; Wren JD (2012). "Bioimage informatics: a new category in Bioinformatics". Bioinformatics. 28 (8): 1057. doi:10.1093/bioinformatics/bts111. PMC   3324521 . PMID   22399678.
  2. 1 2 Murphy, Robert; Velliste, M.; Porreca, G. (2003). "Robust numerical features for description and classification of subcellular location patterns in fluorescence microscope images". The Journal of VLSI Signal Processing. 35 (3): 311–321. CiteSeerX   10.1.1.186.9521 . doi:10.1023/b:vlsi.0000003028.71666.44. S2CID   8134907.
  3. Nattkemper, Tim; Thorsten Twellmann; Helge Ritter; Walter Schubert (2003). "Human vs. machine: evaluation of fluorescence micrographs". Computers in Biology and Medicine. 33 (1): 31–43. CiteSeerX   10.1.1.324.4664 . doi:10.1016/S0010-4825(02)00060-4. PMID   12485628.
  4. Peng H (September 2008). "Bioimage informatics: a new area of engineering biology". Bioinformatics. 24 (17): 1827–36. doi:10.1093/bioinformatics/btn346. PMC   2519164 . PMID   18603566.
  5. "The quest for quantitative microscopy". Nature Methods. 9 (7): 627. 2012. doi: 10.1038/nmeth.2102 . PMID   22930824.
  6. Glory, Estelle; Justin Newberg; Robert F. Murphy (2008). "Automated comparison of protein subcellular location patterns between images of normal and cancerous tissues". Biomedical Imaging: From Nano to Macro, 2008. ISBI 2008. 5th IEEE International Symposium on.
  7. Shariff, Aabid; Joshua Kangas; Luis Pedro Coelho; Shannon Quinn; Robert F Murphy (2010). "Automated image analysis for high-content screening and analysis". Journal of Biomolecular Screening. 15 (7): 726–734. doi: 10.1177/1087057110370894 . PMID   20488979.
  8. Coelho, Luis Pedro; Aabid Shariff; Robert F. Murphy (2009). "Nuclear segmentation in microscope cell images: a hand-segmented dataset and comparison of algorithms". Biomedical Imaging: From Nano to Macro, 2009. ISBI'09. IEEE International Symposium on. IEEE. doi:10.1109/ISBI.2009.5193098. PMC   2901896 .
  9. Long, Fuhui; Peng, H.; Liu, X.; Kim, S.; Myers, E.W (Sep 2009). "A 3D digital atlas of C. elegans and its application to single-cell analyses". Nature Methods. 6 (9): 667–672. doi:10.1038/nmeth.1366. PMC   2882208 . PMID   19684595.
  10. Qu, Lei; Long, F.; Liu, X.; Kim, S.; Myers, E.W.; Peng, H. (2011). "Simultaneous recognition and segmentation of cells: application in C. elegans". Bioinformatics. 27 (20): 2895–2902. doi:10.1093/bioinformatics/btr480. PMC   3187651 . PMID   21849395.
  11. Dufour, Alexandre; Vasily Shinin; Shahragim Tajbakhsh; Nancy Guillén-Aghion; J-C. Olivo-Marin; Christophe Zimmer (2005). "Segmenting and tracking fluorescent cells in dynamic 3-D microscopy with coupled active surfaces" (PDF). Image Processing, IEEE Transactions on 14, no. 9. pp. 1396–1410. doi:10.1109/TIP.2005.852790. Archived from the original (PDF) on 2014-03-02..
  12. Peng, Hanchuan; Chung, P.; Long, F.; Qu, L.; Jenett, A.; Seeds, A.; Myers, E. W.; Simpson, J. H (2011). "BrainAligner: 3D registration atlases of Drosophila brains". Nature Methods. 8 (6): 493–498. doi:10.1038/nmeth.1602. PMC   3104101 . PMID   21532582.
  13. "Bioimage Informatics Annual Meeting".
  14. Bruijning, Marjolein; Visser, Marco D.; Hallmann, Caspar A.; Jongejans, Eelke; Golding, Nick (2018). "trackdem: Automated particle tracking to obtain population counts and size distributions from videos in r". Methods in Ecology and Evolution. 9 (4): 965–973. doi: 10.1111/2041-210X.12975 . ISSN   2041-210X.