2004 United States presidential election in Pennsylvania

Last updated

2004 United States presidential election in Pennsylvania
Flag of Pennsylvania.svg
  2000 November 2, 2004 2008  
  John F. Kerry.jpg George-W-Bush.jpeg
Nominee John Kerry George W. Bush
Party Democratic Republican
Home state Massachusetts Texas
Running mate John Edwards Dick Cheney
Electoral vote210
Popular vote2,938,0952,793,847
Percentage50.92%48.42%

Pennsylvania Presidential Election Results 2004.svg
Pennsylvania Presidential Results 2004 by Municipality.svg

President before election

George W. Bush
Republican

Elected President

George W. Bush
Republican

The 2004 United States presidential election in Pennsylvania took place on November 2, 2004, and was part of the 2004 United States presidential election. Voters chose 21 representatives, or electors to the Electoral College, who voted for president and vice president.

Contents

Pennsylvania was won by Democratic nominee John Kerry by a 2.50% margin of victory. Prior to the election, most news organizations considered this a toss-up, or swing state. Although the Commonwealth of Pennsylvania voted for the Democratic presidential nominee in six subsequent elections since 1992, the margins of victory had become smaller over the past elections. On election day, Kerry won the state with 50.92% of the vote, but won only 13 of the 67 counties in Pennsylvania. Most of these 13 counties have the highest populations in the commonwealth. The biggest key to Kerry's victory was winning Philadelphia County with 80.44% of the vote.

Bush was the first president elected to two terms without carrying Pennsylvania either time since Woodrow Wilson in 1912 and 1916, and is the only Republican president to not win the state at least once. This to date is the most recent election where Pennsylvania would back the losing candidate, and is thus tied with Wisconsin and Michigan as having the longest bellwether streak in the nation. This was also the first time since 1968 that Pennsylvania voted against the winner of the national popular vote.

As of 2022, this is the last time that Pennsylvania voted to the left of New Mexico and Nevada.

Primaries

Eligibility

In order to vote in the primary, one must have been: [1]

  1. "A citizen of the United States for at least one month before the next primary, special, municipal, or general election."
  2. "A resident of Pennsylvania and the election district in which the individual desires to register and vote for at least 30 days before the next primary, special, municipal, or general election."
  3. "At least 18 years of age on or before the day of the next primary, special, municipal, or general election."
  4. A registered member of the party holding the primary

Convicted felons could not vote from prison and were not allowed to register to vote for five years after being released from prison.

Registration

Individuals could register to vote at County Voter Registration offices, through the mail, at a Department of Transportation office, or at various other government agency offices. [2]

Voters must have been registered 30 days prior to the election in order to be eligible to vote. [2]

Democratic primary election

The Democratic primary took place on April 27, 2004. It was open to registered Democrats only.

Results

100% of precincts reporting
CandidateVotes [3] PercentageDelegates
John Kerry 585,68374.1%150
Howard Dean 79,79910.1%1
John Edwards 76,7629.7%0
Dennis Kucinich 30,1103.8%0
Lyndon Larouche 17,5282.2%0
Uncommitted-2.2%27
Total789,882100%178

Note: Twenty seven delegates remained uncommitted until they reached the floor of the convention. Kerry eventually received all 178 delegates from Pennsylvania. [4]

Republican primary election

The Republican primary took place on April 27, 2004. It was open to registered Republicans only. Incumbent President George W. Bush ran unopposed. [5]

General election

Predictions

There were 12 news organizations who made state-by-state predictions of the election. Here are their last predictions before election day. [6]

SourceRanking
D.C. Political ReportToss-up
Associated PressToss-up
CNNLikely D
Cook Political ReportToss-up
NewsweekLean D
New York TimesLean D
Rasmussen ReportsToss-up
Research 2000Lean D
Washington PostToss-up
Washington TimesToss-up
Zogby InternationalLikely D
Washington DispatchLikely D

Polling

Al Gore won Pennsylvania in 2000 with just over 50% of the vote. In late October 2004, the state was split at 47% on whether or not to approve of Bush. But Kerry won the poll 48% to 46% in the last Mason Dixon poll. [7] Throughout the election of 2004, Kerry won most of the polls in the upper 40% to lower 50% range. However, Bush polled within the margin of error, usually in the mid 40% range. In the last Real Clear Politics average Kerry was leading with 48% and by almost a 1% margin. [8]

Fundraising

Bush raised $5,030,349. [9] Kerry raised $4,998,861. [10]

Advertising and visits

President Bush campaigned heavily and visited the state of Pennsylvania over twenty times in 2004. It was not enough to flip the state, as John Kerry won the undecided Pennsylvanians. He won the state's electors with almost 51% of the vote, outperforming Vice President Al Gore’s performance four years earlier. [11] [12]

Analysis

This Kerry victory can be attributed to the overwhelmingly Democratic cities of Philadelphia, Pittsburgh, and Erie. Although Kerry-held cities which voted for the Senator by narrow margins assisted him in advancing his margin over President Bush, many political analysts underscored the fact that if Philadelphia were excluded, President George W. Bush would have won Pennsylvania by a fairly slim margin, with 2,663,748 versus 2,395,890 for Kerry. Although Pennsylvania is closely divided in most elections, it did not vote Republican in a presidential election from 1992 to 2012.

Philadelphia and Pittsburgh were the biggest contributors to Kerry's victory in Pennsylvania. However, many independents in suburban Philadelphia counties (Bucks, Delaware, Montgomery, and somewhat in Chester) voted for Kerry, which may well have been the deciding factor. Kerry also had narrow margins of victory around cities like Allentown, Scranton, Erie, and the traditionally Democratic Pittsburgh suburbs; he also garnered many votes in certain rural areas such as parts of the Poconos and the Laurel Highlands, and in cities like Reading, Johnstown, Harrisburg, and State College. Bush's margins were extremely large in Central Pennsylvania and the sparsely populated Northern Tier, with traditional GOP cities such as Lancaster, Lebanon, York, Altoona, Huntingdon, and Williamsport strongly throwing their support behind him. This area, along with rural western Maryland, was clearly the most conservative in the Mid-Atlantic.

As of the 2020 presidential election , this is the last presidential election that the Democratic candidate won any county bordering Allegheny County, namely Washington County, Beaver County and Fayette County. This is also the last election in which Dauphin County, Centre County, and Monroe County voted for the Republican candidate. This is also the last time that Chester County gave a majority to a Republican, although Mitt Romney did win the county with a plurality in 2012.

Results

2004 United States presidential election in Pennsylvania
PartyCandidateVotesPercentageElectoral votes
Democratic John Kerry 2,938,09550.92%21
Republican George W. Bush (Incumbent)2,793,84748.42%0
Libertarian Michael Badnarik 21,1850.37%0
Green David Cobb 6,3190.11%0
Constitution Michael Peroutka 6,3180.11%0
Independent Ralph Nader (write-in) [13] [lower-alpha 1] 2,6560.05%0
IndependentWrite Ins1,1700.02%0
Totals5,769,590100.00%21
Voter turnout (Voting Age population)60.5%

By county

County [15] John Kerry
Democratic
George W. Bush
Republican
Michael J. Badnarik
Libertarian
David Cobb
Green
Michael Peroutka
Constitution
MarginTotal votes cast
#%#%#%#%#%#%
Adams 13,76432.59%28,24766.89%950.22%630.15%590.14%-14,483-34.30%42,228
Allegheny 368,91257.15%271,92542.13%3,5730.55%5510.09%5080.08%96,98715.02%645,469
Armstrong 12,02538.67%18,92560.86%560.18%410.13%500.16%-6,900-22.19%31,097
Beaver 42,14651.06%39,91648.36%1650.20%1410.17%1750.21%2,2302.70%82,543
Bedford 6,01626.53%16,60673.22%190.08%150.07%230.10%-10,590-46.69%22,679
Berks 76,30946.39%87,12252.97%5510.33%2950.18%2100.13%-10,813-6.58%164,487
Blair 18,10533.42%35,75165.99%2100.39%540.10%580.11%-17,646-32.57%54,178
Bradford 8,59033.49%16,94266.05%570.22%270.11%360.14%-8,352-32.56%25,652
Bucks 163,43851.10%154,46948.30%1,3380.42%3080.10%2630.08%8,9692.80%319,816
Butler 30,09035.22%54,95964.34%1820.21%830.10%1110.13%-24,869-29.12%85,425
Cambria 32,59148.66%34,04850.83%1590.24%860.13%990.15%-1,457-2.17%66,983
Cameron 79433.00%1,59966.46%80.33%30.12%20.08%-805-33.46%2,406
Carbon 12,22348.81%12,51949.99%2290.91%420.17%300.12%-296-1.18%25,043
Centre 30,73347.74%33,13351.47%2270.35%900.14%700.11%-2,400-3.73%64,374
Chester 109,70847.53%120,03652.00%6320.27%2630.11%1840.08%-10,328-4.47%230,823
Clarion 6,04935.20%11,06364.38%370.22%190.11%160.09%-5,014-29.18%17,184
Clearfield 13,51839.49%20,53359.98%680.20%470.14%670.20%-7,015-20.49%34,233
Clinton 5,82341.69%8,03557.53%830.59%130.09%130.09%-2,212-15.84%13,967
Columbia 10,67939.74%16,05259.74%570.21%390.15%420.16%-5,373-20.00%26,869
Crawford 16,01341.79%21,96557.32%1760.46%630.16%1050.27%-5,952-15.53%38,322
Cumberland 37,92835.75%67,64863.77%2650.25%1120.11%1290.12%-29,720-28.02%106,082
Dauphin 55,29945.62%65,29653.87%2740.23%1710.14%1680.14%-9,997-8.25%121,208
Delaware 162,60157.15%120,42542.32%9460.33%3120.11%2540.09%42,17614.83%284,538
Elk 6,60245.37%7,87254.10%250.17%200.14%310.21%-1,270-8.73%14,550
Erie 67,92153.95%57,37245.57%3340.27%1590.13%1120.09%10,5498.38%125,898
Fayette 29,12053.23%25,04545.78%4470.82%430.08%520.10%4,0757.45%54,707
Forest 98938.44%1,57161.06%80.31%30.12%20.08%-582-22.62%2,573
Franklin 16,56228.28%41,81771.40%900.15%440.08%560.10%-25,255-43.12%58,569
Fulton 1,47523.52%4,77276.10%150.24%40.06%50.08%-3,297-52.58%6,271
Greene 7,67449.30%7,78650.02%320.21%440.28%290.19%-112-0.72%15,565
Huntingdon 5,87932.56%12,12667.15%200.11%190.11%140.08%-6,247-34.59%18,058
Indiana 15,83143.67%20,25455.88%770.21%470.13%390.11%-4,423-12.21%36,248
Jefferson 6,07331.05%13,37168.36%580.30%280.14%300.15%-7,298-37.31%19,560
Juniata 2,79727.95%7,14471.40%300.30%150.15%200.20%-4,347-43.45%10,006
Lackawanna 59,57356.30%44,76642.30%1,2881.22%1130.11%790.07%14,80714.00%105,819
Lancaster 74,32833.58%145,59165.77%7050.32%2550.12%3990.18%-71,263-32.19%221,372
Lawrence 21,38749.23%21,93850.50%560.13%260.06%350.08%-551-1.27%43,442
Lebanon 18,10932.53%37,08966.63%3230.58%510.09%930.17%-18,980-34.10%55,665
Lehigh 73,94050.96%70,16048.36%6380.44%1600.11%1930.13%3,7802.60%145,091
Luzerne 69,57351.15%64,95347.75%1,1950.88%1800.13%1270.09%4,6203.40%136,028
Lycoming 15,68131.31%33,96167.81%2790.56%770.15%510.10%-18,280-36.50%50,081
Mckean 6,29436.12%10,94162.79%1480.85%230.13%200.11%-4,647-26.67%17,426
Mercer 24,83148.16%26,31151.03%1490.29%1330.26%1400.27%-1,480-2.87%51,564
Mifflin 4,88929.10%11,72669.79%1440.86%200.12%230.14%-6,837-40.69%16,802
Monroe 27,96749.64%27,97149.65%2870.51%640.11%530.09%-4-0.01%56,342
Montgomery 222,04855.57%175,74143.98%1,0880.27%3490.09%3650.09%46,30711.59%399,591
Montour 2,66634.97%4,90364.31%340.45%100.13%110.14%-2,237-29.34%7,624
Northampton 63,44650.02%62,10248.96%8850.70%1870.15%1200.09%1,3441.06%126,849
Northumberland 14,60239.32%22,26259.95%1390.37%470.13%840.23%-7,660-20.63%37,134
Perry 5,42327.91%13,91971.65%360.19%240.12%250.13%-8,496-43.74%19,427
Philadelphia 542,20580.44%130,09919.30%8950.13%4830.07%3870.06%412,10661.14%674,069
Pike 8,65640.64%12,44458.43%1440.68%310.15%240.11%-3,788-17.79%21,299
Potter 2,26828.49%5,64070.84%180.23%90.11%270.34%-3,372-42.35%7,962
Schuylkill 29,23144.79%35,64054.60%1860.28%1290.20%830.13%-6,409-9.81%65,269
Snyder 4,34829.02%10,56670.52%330.22%180.12%180.12%-6,218-41.50%14,983
Somerset 12,84234.92%23,80264.72%480.13%380.10%480.13%-10,960-29.80%36,778
Sullivan 1,21336.93%2,05662.59%100.30%50.15%10.03%-843-25.66%3,285
Susquehanna 7,35138.61%11,57360.78%540.28%330.17%290.15%-4,222-22.17%19,040
Tioga 5,43730.94%12,01968.40%490.28%230.13%430.24%-6,582-37.46%17,571
Union 5,70035.35%10,33464.09%460.29%300.19%130.08%-4,634-28.74%16,123
Venango 9,02438.14%14,47261.17%930.39%310.13%390.16%-5,448-23.03%23,659
Warren 8,04441.74%10,99957.07%790.41%340.18%1170.61%-2,955-15.33%19,273
Washington 48,22550.14%47,67349.57%1420.15%590.06%780.08%5520.57%96,177
Wayne 8,06036.69%13,71362.43%1360.62%230.10%350.16%-5,653-25.74%21,967
Westmoreland 77,77443.52%100,08756.01%4740.27%1550.09%2060.12%-22,313-12.49%178,696
Wyoming 4,98238.82%7,78260.65%200.16%220.17%260.20%-2,800-21.83%12,832
York 63,70135.53%114,27063.74%8210.46%2130.12%2640.15%-50,569-28.21%179,269
Totals2,938,09550.92%2,793,84748.42%21,1850.37%6,3190.11%6,3180.11%144,2482.50%5,769,590
County Flips:
Democratic
Hold
Republican
Hold
Gain from Democratic Pennsylvania County Flips 2004.svg
County Flips:

Counties that flipped from Democratic to Republican

By congressional district

Kerry won 10 of 19 congressional districts, including four held by Republicans. Bush won 9 districts, including one held by a Democrat. [16]

DistrictBushKerryRepresentative
1st 15%84% Bob Brady
2nd 12%87% Chaka Fattah
3rd 53%47% Phil English
4th 54%45% Melissa Hart
5th 61%39% John E. Peterson
6th 48%52% Jim Gerlach
7th 47%53% Curt Weldon
8th 48%51% James C. Greenwood
Mike Fitzpatrick
9th 67%33% Bill Shuster
10th 60%40% Don Sherwood
11th 47%53% Paul Kanjorski
12th 49%51% John Murtha
13th 43%56% Joe Hoeffel
Allyson Schwartz
14th 30%69% Mike Doyle
15th 50%50% Pat Toomey
Charlie Dent
16th 61%38% Joe Pitts
17th 58%42% Tim Holden
18th 54%46% Tim Murphy
19th 64%36% Todd Platts

Electors

Technically the voters of Pennsylvania cast their ballots for electors: representatives to the Electoral College. Pa. is allocated 21 electors because it has 19 congressional districts and 2 senators. All candidates who appear on the ballot or qualify to receive write-in votes must submit a list of 21 electors, who pledge to vote for their candidate and his or her running mate. Whoever wins the majority of votes in the state is awarded all 21 electoral votes. Their chosen electors then vote for president and vice president. Although electors are pledged to their candidate and running mate, they are not obligated to vote for them. An elector who votes for someone other than his or her candidate is known as a faithless elector.

The electors of each state and the District of Columbia met on December 13, 2004, to cast their votes for president and vice president. The Electoral College itself never meets as one body. Instead the electors from each state and the District of Columbia met in their respective capitols.

The following were the members of the Electoral College from the state. All 21 were pledged for Kerry/Edwards.

  1. Lynne Abraham
  2. Richard Bloomingdale
  3. Blondell Reynolds Brown
  4. Robert Casey Jr.
  5. Eileen Connelly
  6. H. William DeWeese
  7. John Dougherty
  8. Richard E. Filippi
  9. William George
  10. Renee Gillinger
  11. Jennifer Mann
  12. Robert J. Mellow
  13. Dan Onorato
  14. Juan Ramos
  15. Stephen R. Reed
  16. T.J. Rooney
  17. Jonathan Saidel
  18. John F. Street
  19. Rosemary Trump
  20. Sala Udin
  21. Constance H. Williams

See also

Notes

  1. Nader initially qualified to appear on the ballot via petition, but on October 13, 2004, a ruling of the Commonwealth Court of Pennsylvania removed him from the ballot after finding that most of the petition's signatures were invalid or forged. [14]

Related Research Articles

<span class="mw-page-title-main">2004 United States presidential election in California</span>

The 2004 United States presidential election in California took place on November 2, 2004, and was part of the 2004 United States presidential election. Voters chose 55 representatives, or electors to the Electoral College, who voted for president and vice president.

<span class="mw-page-title-main">2004 United States presidential election in Illinois</span>

The 2004 United States presidential election in Illinois took place on November 2, 2004, and was part of the 2004 United States presidential election. Voters chose 21 representatives, or electors to the Electoral College, who voted for president and vice president.

<span class="mw-page-title-main">2004 United States presidential election in Texas</span> Election in Texas

The 2004 United States presidential election in Texas took place on November 2, 2004, and was part of the 2004 United States presidential election. State voters chose 34 representatives, or electors to the Electoral College, who voted for president and vice president.

<span class="mw-page-title-main">2004 United States presidential election in Florida</span> Election in Florida

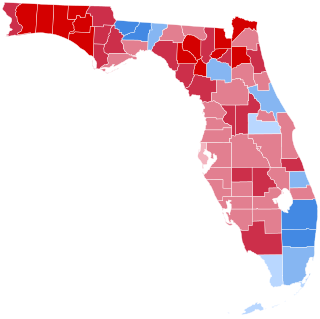
The 2004 United States presidential election in Florida took place on November 2, 2004, as part of the 2004 United States presidential election. Voters chose 27 representatives, or electors to the Electoral College, who voted for president and vice president.

<span class="mw-page-title-main">2004 United States presidential election in Ohio</span> Election in Ohio

The 2004 United States presidential election in Ohio took place on November 2, 2004, and was part of the 2004 United States presidential election. Voters chose 20 representatives, or electors to the Electoral College, who voted for president and vice president.

<span class="mw-page-title-main">2004 United States presidential election in Georgia</span> Election in Georgia

The 2004 United States presidential election in Georgia took place on November 2, 2004. Voters chose 15 representatives, or electors to the Electoral College, who voted for president and vice president.

<span class="mw-page-title-main">2004 United States presidential election in New Jersey</span> Election in New Jersey

The 2004 United States presidential election in New Jersey took place on November 2, 2004, and was part of the 2004 United States presidential election. Voters chose 15 representatives, or electors to the Electoral College, who voted for president and vice president.

<span class="mw-page-title-main">2004 United States presidential election in Wisconsin</span> Election in Wisconsin

The 2004 United States presidential election in Wisconsin took place on November 2, 2004, and was part of the 2004 United States presidential election. Voters chose 10 representatives, or electors to the Electoral College, who voted for president and vice president.

<span class="mw-page-title-main">2004 United States presidential election in Alabama</span> Election in Alabama

The 2004 United States presidential election in Alabama took place on November 2, 2004. Voters chose nine representatives, or electors, to the Electoral College, who voted for president and vice president.

<span class="mw-page-title-main">2004 United States presidential election in Colorado</span> Election in Colorado

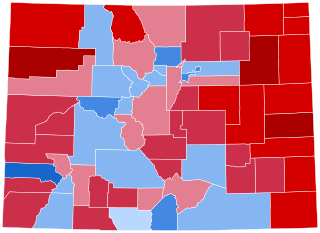
The 2004 United States presidential election in Colorado took place on November 2, 2004, and was part of the 2004 United States presidential election. Voters chose nine representatives, or electors to the Electoral College, who voted for president and vice president.

<span class="mw-page-title-main">2004 United States presidential election in Connecticut</span> Election in Connecticut

The 2004 United States presidential election in Connecticut took place on November 2, 2004, and was part of the 2004 United States presidential election. Voters chose seven representatives, or electors to the Electoral College, who voted for president and vice president.

<span class="mw-page-title-main">2004 United States presidential election in New York</span>

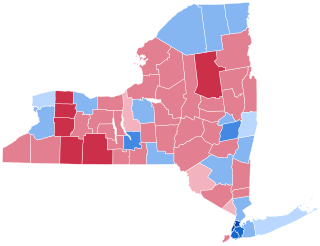
The 2004 United States presidential election in New York took place on November 2, 2004, and was part of the 2004 United States presidential election. Voters chose 31 representatives, or electors to the Electoral College, who voted for president and vice president.

<span class="mw-page-title-main">2004 United States presidential election in New Hampshire</span> Election in New Hampshire

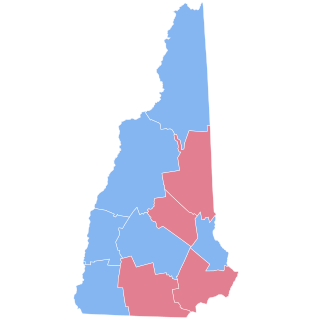
The 2004 United States presidential election in New Hampshire took place on November 2, 2004, and was part of the 2004 United States presidential election. Voters chose four representatives, or electors to the Electoral College, who voted for president and vice president.

<span class="mw-page-title-main">2004 United States presidential election in Massachusetts</span> Election in Massachusetts

The 2004 United States presidential election in Massachusetts took place on November 2, 2004, and was part of the 2004 United States presidential election. Voters chose 12 representatives, or electors to the Electoral College, who voted for president and vice president.

<span class="mw-page-title-main">2004 United States presidential election in Minnesota</span>

The 2004 United States presidential election in Minnesota took place on November 2, 2004 as part of the 2004 United States presidential election. Voters chose ten representatives, or electors to the Electoral College, who voted for president and vice president.

<span class="mw-page-title-main">2004 United States presidential election in Missouri</span> Election in Missouri

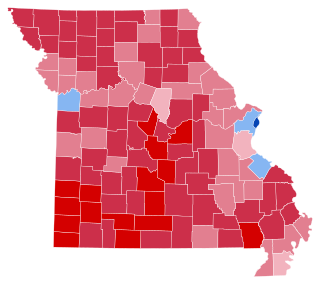
The 2004 United States presidential election in Missouri took place on November 2, 2004, and was part of the 2004 United States presidential election. Voters chose 11 representatives, or electors to the Electoral College, who voted for president and vice president.

<span class="mw-page-title-main">2004 United States presidential election in Kentucky</span> Election in Kentucky

The 2004 United States presidential election in Kentucky took place on November 2, 2004, and was part of the 2004 United States presidential election. Voters chose eight representatives, or electors to the Electoral College, who voted for president and vice president.

<span class="mw-page-title-main">2004 United States presidential election in Maryland</span> U.S. presidential election in Maryland

The 2004 United States presidential election in Maryland took place on November 2, 2004, and was part of the 2004 United States presidential election. Voters chose 10 representatives, or electors to the Electoral College, who voted for president and vice president.

<span class="mw-page-title-main">2004 United States presidential election in Michigan</span> Election in Michigan

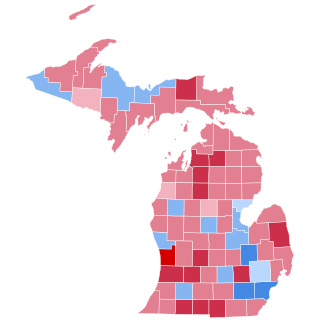
The 2004 United States presidential election in Michigan took place on November 2, 2004, and was part of the 2004 United States presidential election. Voters chose 17 representatives, or electors to the Electoral College, who voted for president and vice president.

<span class="mw-page-title-main">2008 United States presidential election in Ohio</span> Election in Ohio

The 2008 United States presidential election in Ohio took place on November 4, 2008, which was part of the 2008 United States presidential election. Voters chose 20 representatives, or electors to the Electoral College, who voted for president and vice president.

References

  1. Pennsylvania Department of State
  2. 1 2 Pennsylvania Department of State
  3. "Pennsylvania Department of State - Commissions, Elections, and Legislation". Archived from the original on December 27, 2005. Retrieved August 6, 2012.
  4. Pennsylvania Democratic Delegation 2004
  5. "2004 General Primary". Elections Information. Pennsylvania Department of State. Retrieved August 6, 2012.
  6. "Archived copy". dcpoliticalreport.com. Archived from the original on November 21, 2010. Retrieved January 13, 2022.{{cite web}}: CS1 maint: archived copy as title (link)
  7. NBC News
  8. "RealClear Politics - Polls".
  9. "George W Bush - $374,659,453 raised, '04 election cycle, Republican Party, President".
  10. "John F Kerry - $345,826,176 raised, '04 election cycle, Democrat Party, President".
  11. "America votes 2004: Candidate tracker". CNN . Retrieved May 27, 2022.
  12. "America votes 2004: Campaign ad buys". CNN. Archived from the original on April 22, 2021. Retrieved May 27, 2022.
  13. "Pennsylvania notes from the campaign trail". WNEP. Associated Press. October 2004. Archived from the original on November 16, 2004. Retrieved April 26, 2024.
  14. Zernike, Kate (October 14, 2004). "Court Strikes Nader From Pennsylvania Ballot" . The New York Times . p. A25. Retrieved April 26, 2024.
  15. "Pennsylvania Elections – County Breakdown Results". electionreturns.pa.gov. November 2, 2004. Retrieved December 28, 2019.
  16. "Presidential Results by Congressional District, 2000-2008 – Swing State Project".