This is a list of districts of England showing their ethnic composition as recorded in the 2021 census. [1]
Census respondents were asked "What is your ethnic group? Choose ONE section from A to E, then tick the appropriate box to indicate your cultural background." The sections offered were:
See also List of English districts by population - List of English districts by area.
District | White % | Mixed % | Asian % | Black % | Arab or Other % |
---|---|---|---|---|---|
Adur | 93.4 | 2.5 | 2.2 | 0.8 | 1.1 |
Allerdale | 98.5 | 0.7 | 0.6 | 0.1 | 0.2 |
Amber Valley | 97.3 | 1.2 | 1 | 0.3 | 0.2 |
Arun | 95.8 | 1.5 | 1.6 | 0.5 | 0.6 |
Ashfield | 95.1 | 1.6 | 1.6 | 1.2 | 0.4 |
Ashford | 88.1 | 2.2 | 5.8 | 2.6 | 1.4 |
Babergh | 96.7 | 1.5 | 0.9 | 0.5 | 0.4 |
Barking and Dagenham | 44.9 | 4.3 | 25.9 | 21.4 | 3.6 |
Barnet | 57.7 | 5.4 | 19.3 | 7.9 | 9.8 |
Barnsley | 96.9 | 0.9 | 0.9 | 0.7 | 0.5 |
Barrow-in-Furness | 97 | 0.8 | 1.4 | 0.4 | 0.4 |
Basildon | 87.5 | 2.6 | 4.3 | 4.8 | 0.9 |
Basingstoke and Deane | 88.5 | 2.5 | 5.9 | 2 | 1.1 |
Bassetlaw | 96.4 | 1.2 | 1.2 | 0.6 | 0.5 |
Bath and North East Somerset | 92.2 | 2.7 | 3.3 | 1 | 0.8 |
Bedford | 75.7 | 4.6 | 12.6 | 5.3 | 1.8 |
Bexley | 71.9 | 3.5 | 9.9 | 12.2 | 2.5 |
Birmingham | 48.6 | 4.8 | 31 | 11 | 4.5 |
Blaby | 86.2 | 2.7 | 8.3 | 1.5 | 1.3 |
Blackburn with Darwen | 60.4 | 1.7 | 35.7 | 0.9 | 1.4 |
Blackpool | 94.7 | 1.6 | 2.6 | 0.5 | 0.6 |
Bolsover | 97.4 | 0.9 | 0.9 | 0.5 | 0.3 |
Bolton | 71.9 | 2.2 | 20.1 | 3.8 | 1.9 |
Boston | 94.7 | 1.4 | 2 | 0.7 | 1.2 |
Bournemouth, Christchurch and Poole | 91.3 | 2.8 | 3.4 | 1.1 | 1.5 |
Bracknell Forest | 86.1 | 3.1 | 7.1 | 2.4 | 1.3 |
Bradford | 61.1 | 2.7 | 32.1 | 2 | 2 |
Braintree | 94.7 | 1.9 | 1.7 | 1.2 | 0.5 |
Breckland | 96.5 | 1.4 | 0.9 | 0.6 | 0.6 |
Brent | 34.6 | 5.1 | 32.8 | 17.5 | 10 |
Brentwood | 88.5 | 3.1 | 5.1 | 2.3 | 1.1 |
Brighton & Hove | 85.4 | 4.8 | 4.8 | 2 | 3.1 |
Bristol | 81.1 | 4.5 | 6.6 | 5.9 | 1.9 |
Broadland | 96.3 | 1.4 | 1.4 | 0.5 | 0.4 |
Bromley | 76.5 | 5.4 | 8.3 | 7.6 | 2.3 |
Bromsgrove | 93.1 | 2.4 | 3.2 | 0.8 | 0.5 |
Broxbourne | 81.1 | 4 | 3.7 | 6.7 | 4.6 |
Broxtowe | 88.9 | 2.5 | 5.5 | 1.7 | 1.3 |
Buckinghamshire | 79.9 | 3.5 | 12.4 | 2.6 | 1.6 |
Burnley | 82.5 | 1.6 | 14.7 | 0.3 | 0.8 |
Bury | 82.9 | 2.6 | 10.6 | 1.9 | 1.9 |
Calderdale | 86.1 | 1.9 | 10.5 | 0.7 | 0.8 |
Cambridge | 74.5 | 5.1 | 14.8 | 2.4 | 3.1 |
Camden | 59.5 | 6.6 | 18.1 | 9 | 6.8 |
Cannock Chase | 96.6 | 1.4 | 1.2 | 0.5 | 0.3 |
Canterbury | 89.2 | 2.7 | 4.1 | 2.5 | 1.5 |
Carlisle | 96.8 | 0.9 | 1.5 | 0.3 | 0.5 |
Castle Point | 94.9 | 1.6 | 1.7 | 1.3 | 0.5 |
Central Bedfordshire | 90.2 | 3 | 3.5 | 2.4 | 0.8 |
Charnwood | 82.3 | 2.5 | 12.4 | 1.5 | 1.2 |
Chelmsford | 88.5 | 2.6 | 5.3 | 2.6 | 0.9 |
Cheltenham | 91.4 | 2.5 | 4.1 | 1 | 1 |
Cherwell | 88.1 | 2.9 | 6 | 1.8 | 1.3 |
Cheshire East | 94.4 | 1.8 | 2.4 | 0.6 | 0.8 |
Cheshire West and Chester | 95.3 | 1.5 | 2 | 0.6 | 0.6 |
Chesterfield | 95.5 | 1.4 | 1.9 | 0.8 | 0.4 |
Chichester | 95.4 | 1.6 | 1.7 | 0.6 | 0.5 |
Chorley | 95.6 | 1.5 | 1.9 | 0.6 | 0.4 |
City of London | 69.4 | 5.5 | 16.8 | 2.7 | 5.6 |
Colchester | 87 | 2.9 | 5.1 | 3.5 | 1.5 |
Copeland | 98 | 0.7 | 0.8 | 0.3 | 0.3 |
Cornwall | 96.8 | 1.2 | 0.7 | 0.2 | 1.1 |
Cotswold | 96.3 | 1.5 | 1.3 | 0.4 | 0.4 |
County Durham | 96.8 | 0.9 | 1.5 | 0.3 | 0.4 |
Coventry | 65.5 | 3.4 | 18.5 | 8.9 | 3.7 |
Craven | 96.9 | 1 | 1.7 | 0.2 | 0.3 |
Crawley | 73.4 | 4.1 | 15.4 | 4.5 | 2.7 |
Croydon | 48.4 | 7.6 | 17.5 | 22.6 | 3.9 |
Dacorum | 86.8 | 3.4 | 5.8 | 2.8 | 1.2 |
Darlington | 94.4 | 1.4 | 2.8 | 0.7 | 0.9 |
Dartford | 74.5 | 3.1 | 9.9 | 10.5 | 2 |
Derby | 73.8 | 3.7 | 15.6 | 4 | 2.9 |
Derbyshire Dales | 97.8 | 1 | 0.7 | 0.2 | 0.3 |
Doncaster | 93.1 | 1.5 | 2.9 | 1.2 | 1.2 |
Dorset | 97.1 | 1.2 | 1.1 | 0.3 | 0.4 |
Dover | 94.9 | 1.5 | 2.1 | 0.7 | 0.9 |
Dudley | 84.9 | 2.8 | 8.4 | 2.5 | 1.4 |
Ealing | 43.2 | 5.2 | 30.3 | 10.8 | 10.6 |
East Cambridgeshire | 94.5 | 2.1 | 1.9 | 0.8 | 0.7 |
East Devon | 97.4 | 1.1 | 1 | 0.2 | 0.3 |
East Hampshire | 95.4 | 1.7 | 1.9 | 0.5 | 0.5 |
East Hertfordshire | 92.3 | 2.8 | 2.7 | 1.3 | 0.9 |
East Lindsey | 97.8 | 1 | 0.8 | 0.2 | 0.2 |
East Riding of Yorkshire | 97.4 | 0.9 | 1.1 | 0.3 | 0.4 |
East Staffordshire | 86.3 | 2.2 | 9.3 | 1.1 | 1.1 |
East Suffolk District | 96.2 | 1.5 | 1.4 | 0.6 | 0.4 |
Eastbourne | 90.8 | 2.8 | 3.5 | 1.3 | 1.7 |
Eastleigh | 92.4 | 2.1 | 3.9 | 1 | 0.7 |
Eden | 98.1 | 0.7 | 0.8 | 0.2 | 0.3 |
Elmbridge | 86.1 | 4.1 | 6.5 | 1.2 | 2 |
Enfield | 52.1 | 5.9 | 11.5 | 18.3 | 12.1 |
Epping Forest | 84.1 | 3.6 | 7.2 | 2.9 | 2.2 |
Epsom and Ewell | 79.5 | 4.4 | 11.4 | 1.9 | 2.8 |
Erewash | 95.4 | 1.8 | 1.6 | 0.8 | 0.4 |
Exeter | 90.3 | 2.5 | 4.9 | 0.9 | 1.4 |
Fareham | 95.6 | 1.5 | 1.8 | 0.6 | 0.4 |
Fenland | 95.9 | 1.4 | 1.2 | 0.8 | 0.7 |
Folkestone and Hythe | 92.6 | 1.9 | 3.9 | 0.6 | 1 |
Forest of Dean | 97.5 | 1.1 | 0.7 | 0.3 | 0.4 |
Fylde | 96.3 | 1.4 | 1.4 | 0.4 | 0.5 |
Gateshead | 93.5 | 1.2 | 2.5 | 1.1 | 1.6 |
Gedling | 89.5 | 3.5 | 3.9 | 2.3 | 0.9 |
Gloucester | 84.9 | 3.8 | 6.5 | 3.6 | 1.2 |
Gosport | 95.3 | 1.5 | 1.4 | 1.2 | 0.5 |
Gravesham | 76.6 | 2.6 | 11.2 | 6.5 | 3 |
Great Yarmouth | 94.6 | 1.6 | 1.9 | 1.1 | 0.8 |
Greenwich | 55.7 | 6 | 13.2 | 21 | 4.2 |
Guildford | 86.9 | 3.1 | 6.7 | 1.5 | 1.9 |
Hackney | 53.1 | 6.7 | 10.4 | 21.1 | 8.7 |
Halton | 96.5 | 1.4 | 1.1 | 0.4 | 0.6 |
Hambleton | 97.9 | 0.8 | 0.7 | 0.3 | 0.3 |
Hammersmith and Fulham | 63.2 | 6.7 | 10.5 | 12.3 | 7.3 |
Harborough | 91 | 2.1 | 5.4 | 0.7 | 0.8 |
Haringey | 57 | 7 | 8.7 | 17.6 | 9.7 |
Harlow | 82.7 | 3.3 | 6 | 6.2 | 1.8 |
Harrogate | 95.4 | 1.6 | 1.8 | 0.6 | 0.5 |
Harrow | 36.5 | 3.8 | 45.2 | 7.3 | 7.2 |
Hart | 92.5 | 2.2 | 3.6 | 0.8 | 0.8 |
Hartlepool | 96.5 | 0.7 | 1.7 | 0.5 | 0.6 |
Hastings | 91.4 | 2.9 | 2.8 | 1.4 | 1.5 |
Havant | 95.9 | 1.4 | 1.7 | 0.6 | 0.4 |
Havering | 75.3 | 3.7 | 10.7 | 8.2 | 2 |
Herefordshire | 96.9 | 1.1 | 1.2 | 0.3 | 0.5 |
Hertsmere | 77.1 | 3.7 | 10.5 | 4.8 | 3.8 |
High Peak | 97.4 | 1.3 | 0.8 | 0.2 | 0.2 |
Hillingdon | 48.2 | 4.4 | 33.3 | 7.8 | 6.3 |
Hinckley and Bosworth | 94.3 | 1.8 | 2.8 | 0.6 | 0.6 |
Horsham | 93.6 | 2.1 | 2.7 | 0.9 | 0.6 |
Hounslow | 44.1 | 4.7 | 36.7 | 7.2 | 7.3 |
Hull | 91.8 | 1.7 | 2.8 | 1.9 | 1.8 |
Huntingdonshire | 92.4 | 2.2 | 3.2 | 1.5 | 0.7 |
Hyndburn | 82.7 | 1.3 | 15.1 | 0.3 | 0.7 |
Ipswich | 84.3 | 4.6 | 5.5 | 3.5 | 2.1 |
Isle of Wight | 97 | 1.2 | 1.2 | 0.3 | 0.3 |
Isles of Scilly | 97.5 | 1.1 | 0.3 | 0.2 | 0.9 |
Islington | 62.2 | 7.5 | 9.9 | 13.3 | 7.1 |
Kensington and Chelsea | 63.7 | 6.6 | 11.9 | 7.9 | 9.9 |
King's Lynn and West Norfolk | 95.6 | 1.3 | 1.9 | 0.5 | 0.7 |
Kingston upon Thames | 68.3 | 5.4 | 17.8 | 2.8 | 5.7 |
Kirklees | 73.6 | 3.1 | 19.4 | 2.3 | 1.5 |
Knowsley | 95.3 | 1.7 | 1.6 | 0.8 | 0.6 |
Lambeth | 55 | 8.1 | 7.3 | 24 | 5.7 |
Lancaster | 93.1 | 1.5 | 3.6 | 0.9 | 0.9 |
Leeds | 79 | 3.4 | 9.7 | 5.6 | 2.3 |
Leicester | 40.9 | 3.8 | 43.4 | 7.8 | 4.1 |
Lewes | 94.2 | 2.5 | 1.9 | 0.7 | 0.7 |
Lewisham | 51.5 | 8.1 | 9 | 26.8 | 4.7 |
Lichfield | 94.8 | 1.9 | 2.3 | 0.6 | 0.4 |
Lincoln | 92.2 | 2 | 3.2 | 1.4 | 1.2 |
Liverpool | 84 | 3.5 | 5.7 | 3.5 | 3.3 |
Luton | 45.2 | 4.3 | 37 | 10.1 | 3.5 |
Maidstone | 89.8 | 2.3 | 4.7 | 2.1 | 1.2 |
Maldon | 96.9 | 1.4 | 1.1 | 0.4 | 0.3 |
Malvern Hills | 96.6 | 1.4 | 1.3 | 0.3 | 0.3 |
Manchester | 56.8 | 5.3 | 20.9 | 11.9 | 5.1 |
Mansfield | 94.8 | 1.4 | 2 | 1.1 | 0.7 |
Medway | 84.3 | 2.8 | 5.9 | 5.6 | 1.4 |
Melton | 96.9 | 1.3 | 1.2 | 0.4 | 0.3 |
Mendip | 96.8 | 1.4 | 1.1 | 0.3 | 0.3 |
Merton | 60.2 | 5.9 | 18.6 | 10.6 | 4.6 |
Mid Devon | 97.8 | 1.1 | 0.7 | 0.1 | 0.3 |
Mid Suffolk | 96.8 | 1.4 | 0.8 | 0.5 | 0.4 |
Mid Sussex | 92.2 | 2.5 | 3.6 | 0.9 | 0.8 |
Middlesbrough | 82.4 | 2.1 | 10.5 | 2.7 | 2.4 |
Milton Keynes | 71.8 | 4.1 | 12.4 | 9.7 | 2 |
Mole Valley | 92.7 | 2.5 | 3 | 0.8 | 0.9 |
New Forest | 96.8 | 1.3 | 1.2 | 0.4 | 0.4 |
Newark and Sherwood | 96.3 | 1.5 | 1.1 | 0.7 | 0.4 |
Newcastle upon Tyne | 80 | 2.3 | 11.4 | 3.3 | 3.1 |
Newcastle-under-Lyme | 92.9 | 1.6 | 3.8 | 1 | 0.7 |
Newham | 30.8 | 4.7 | 42.2 | 17.5 | 4.9 |
North Devon | 97 | 1.2 | 1.2 | 0.3 | 0.3 |
North East Derbyshire | 97.4 | 1.1 | 0.9 | 0.3 | 0.2 |
North East Lincolnshire | 96.2 | 1 | 1.6 | 0.5 | 0.7 |
North Hertfordshire | 87.5 | 3.7 | 5.2 | 2.4 | 1.1 |
North Kesteven | 97.2 | 1.2 | 1 | 0.4 | 0.3 |
North Lincolnshire | 94.3 | 1.1 | 3.3 | 0.5 | 0.8 |
North Norfolk | 98.1 | 0.9 | 0.5 | 0.2 | 0.2 |
North Northamptonshire | 90.3 | 2.3 | 3.5 | 3.1 | 0.8 |
North Somerset | 95.7 | 1.7 | 1.5 | 0.5 | 0.6 |
North Tyneside | 94.9 | 1.4 | 2.6 | 0.6 | 0.6 |
North Warwickshire | 96.1 | 1.7 | 1.3 | 0.6 | 0.3 |
North West Leicestershire | 95.9 | 1.5 | 1.5 | 0.6 | 0.5 |
Northumberland | 97.6 | 0.8 | 1.1 | 0.2 | 0.3 |
Norwich | 87.1 | 3.1 | 5.5 | 2.5 | 1.8 |
Nottingham | 65.9 | 5.9 | 14.9 | 10 | 3.3 |
Nuneaton and Bedworth | 87.1 | 1.8 | 8 | 1.8 | 1.2 |
Oadby and Wigston | 63.4 | 3.2 | 27.9 | 2.2 | 3.3 |
Oldham | 68.1 | 2.5 | 24.6 | 3.4 | 1.4 |
Oxford | 70.7 | 5.6 | 15.4 | 4.7 | 3.7 |
Pendle | 70.6 | 1.6 | 26.7 | 0.3 | 0.9 |
Peterborough | 75.4 | 3.5 | 14.3 | 4.1 | 2.7 |
Plymouth | 94 | 1.8 | 2.2 | 1.1 | 1 |
Portsmouth | 85.2 | 2.6 | 6.9 | 3.4 | 1.8 |
Preston | 72.6 | 3 | 20.2 | 2.4 | 1.9 |
Reading | 67.1 | 5.1 | 17.7 | 7.2 | 2.9 |
Redbridge | 34.8 | 4.1 | 47.3 | 8.4 | 5.4 |
Redcar and Cleveland | 97.7 | 0.9 | 0.8 | 0.2 | 0.4 |
Redditch | 89.8 | 2.6 | 5.7 | 1.2 | 0.6 |
Reigate and Banstead | 84.4 | 3.7 | 7.5 | 2.9 | 1.4 |
Ribble Valley | 96.2 | 1.2 | 2.1 | 0.2 | 0.3 |
Richmond upon Thames | 80.5 | 5.5 | 8.9 | 1.9 | 3.3 |
Richmondshire | 94.4 | 0.9 | 2.7 | 0.9 | 1.1 |
Rochdale | 74 | 2.4 | 18.5 | 3.5 | 1.6 |
Rochford | 95.9 | 1.7 | 1.4 | 0.7 | 0.3 |
Rossendale | 92.4 | 1.5 | 5.5 | 0.2 | 0.4 |
Rother | 95.6 | 1.8 | 1.5 | 0.6 | 0.5 |
Rotherham | 91 | 1.4 | 5.3 | 1.1 | 1.1 |
Rugby | 85.7 | 2.8 | 7.6 | 2.7 | 1.1 |
Runnymede | 83.5 | 3.5 | 9.2 | 1.8 | 1.9 |
Rushcliffe | 89.7 | 2.8 | 5.7 | 0.9 | 0.9 |
Rushmoor | 77.4 | 2.6 | 14.7 | 2.5 | 2.8 |
Rutland | 94.8 | 1.8 | 1.5 | 1.3 | 0.5 |
Ryedale | 98.2 | 0.8 | 0.6 | 0.2 | 0.3 |
Salford | 82.3 | 3.1 | 5.5 | 6.1 | 2.9 |
Sandwell | 57.2 | 4.3 | 25.8 | 8.7 | 4 |
Scarborough | 97 | 1 | 1.3 | 0.3 | 0.5 |
Sedgemoor | 96.6 | 1.1 | 1.4 | 0.3 | 0.5 |
Sefton | 95.8 | 1.5 | 1.5 | 0.5 | 0.7 |
Selby | 97.7 | 1 | 0.8 | 0.2 | 0.4 |
Sevenoaks | 92.1 | 2.6 | 2.9 | 1.6 | 0.8 |
Sheffield | 79.1 | 3.5 | 9.6 | 4.6 | 3.2 |
Shropshire | 96.7 | 1.2 | 1.3 | 0.3 | 0.4 |
Slough | 36 | 4 | 46.7 | 7.6 | 5.7 |
Solihull | 82.2 | 3.5 | 11 | 1.8 | 1.5 |
Somerset West and Taunton | 95.6 | 1.3 | 2 | 0.5 | 0.5 |
South Cambridgeshire | 89 | 2.8 | 5.8 | 1.2 | 1.1 |
South Derbyshire | 93.1 | 1.8 | 3.6 | 0.8 | 0.7 |
South Gloucestershire | 91.2 | 2.5 | 3.8 | 1.6 | 0.9 |
South Hams | 97.5 | 1.2 | 0.7 | 0.2 | 0.4 |
South Holland | 96.3 | 1.3 | 1.2 | 0.5 | 0.6 |
South Kesteven | 95.8 | 1.4 | 1.8 | 0.6 | 0.4 |
South Lakeland | 97.7 | 1 | 0.8 | 0.2 | 0.3 |
South Norfolk | 95.4 | 1.5 | 1.8 | 0.8 | 0.5 |
South Oxfordshire | 93.1 | 2.3 | 2.9 | 1 | 0.8 |
South Ribble | 95.4 | 1.7 | 2.1 | 0.5 | 0.3 |
South Somerset | 96.6 | 1.2 | 1.3 | 0.5 | 0.4 |
South Staffordshire | 93.7 | 2 | 2.8 | 0.9 | 0.5 |
South Tyneside | 94.4 | 1.4 | 2.9 | 0.5 | 0.8 |
Southampton | 80.7 | 3.3 | 10.6 | 3 | 2.3 |
Southend-on-Sea | 87.5 | 3.1 | 5.5 | 2.9 | 1.1 |
Southwark | 51.4 | 7.2 | 9.9 | 25.1 | 6.3 |
Spelthorne | 78.7 | 3.7 | 12.8 | 2.5 | 2.4 |
St Albans | 83.6 | 4.3 | 8.2 | 2.1 | 1.8 |
St Helens | 96.5 | 1.1 | 1.4 | 0.4 | 0.6 |
Stafford | 93.4 | 1.9 | 3 | 1.1 | 0.7 |
Staffordshire Moorlands | 98 | 0.9 | 0.7 | 0.2 | 0.2 |
Stevenage | 82.8 | 3.6 | 7.5 | 4.8 | 1.3 |
Stockport | 87.4 | 2.6 | 7.3 | 1.2 | 1.6 |
Stockton-on-Tees | 92 | 1.4 | 4.6 | 1.1 | 0.8 |
Stoke-on-Trent | 83.5 | 2.3 | 9.9 | 2.7 | 1.7 |
Stratford-on-Avon | 95.5 | 1.7 | 1.9 | 0.4 | 0.5 |
Stroud | 96.4 | 1.8 | 1 | 0.4 | 0.4 |
Sunderland | 94.6 | 0.9 | 3 | 1 | 0.5 |
Surrey Heath | 85 | 2.7 | 8.9 | 1.6 | 1.8 |
Sutton | 68.3 | 4.8 | 17.5 | 5.9 | 3.4 |
Swale | 93.8 | 1.8 | 1.5 | 2.3 | 0.5 |
Swindon | 81.5 | 2.8 | 11.6 | 2.6 | 1.5 |
Tameside | 85.5 | 2.1 | 9.2 | 2.3 | 0.8 |
Tamworth | 95.8 | 1.9 | 1.4 | 0.6 | 0.4 |
Tandridge | 89.4 | 3.8 | 3.7 | 2.2 | 0.9 |
Teignbridge | 97.7 | 1.2 | 0.7 | 0.2 | 0.3 |
Telford and Wrekin | 88.2 | 2.6 | 5.4 | 2.9 | 0.9 |
Tendring | 96.2 | 1.6 | 1.2 | 0.6 | 0.4 |
Test Valley | 93.1 | 1.8 | 3.3 | 1.1 | 0.8 |
Tewkesbury | 95.1 | 1.8 | 2 | 0.6 | 0.5 |
Thanet | 93 | 2.4 | 2.3 | 1.1 | 1.2 |
Three Rivers | 77.1 | 3.6 | 15.2 | 2.4 | 1.7 |
Thurrock | 76.7 | 3 | 6.9 | 11.9 | 1.5 |
Tonbridge and Malling | 93.3 | 2.2 | 2.9 | 1 | 0.6 |
Torbay | 96.1 | 1.5 | 1.6 | 0.3 | 0.4 |
Torridge | 98.2 | 0.9 | 0.5 | 0.1 | 0.2 |
Tower Hamlets | 39.4 | 5 | 44.4 | 7.3 | 3.9 |
Trafford | 77.8 | 3.8 | 12.6 | 3.4 | 2.5 |
Tunbridge Wells | 91.5 | 2.6 | 4 | 1 | 1 |
Uttlesford | 94.5 | 2.2 | 1.9 | 0.8 | 0.7 |
Vale of White Horse | 90.8 | 2.5 | 4 | 1.7 | 1.1 |
Wakefield | 93 | 1.4 | 3.6 | 1.3 | 0.7 |
Walsall | 71.4 | 3.3 | 18.7 | 4.6 | 2.1 |
Waltham Forest | 52.8 | 6.5 | 19.9 | 15 | 5.8 |
Wandsworth | 67.8 | 6.3 | 11.7 | 10.1 | 4.1 |
Warrington | 93.5 | 1.6 | 3.3 | 0.7 | 0.9 |
Warwick | 84.6 | 3 | 9.7 | 1.1 | 1.6 |
Watford | 60.9 | 4.7 | 24.5 | 6.3 | 3.6 |
Waverley | 93.7 | 2.2 | 2.8 | 0.7 | 0.6 |
Wealden | 96 | 1.7 | 1.4 | 0.4 | 0.5 |
Welwyn Hatfield | 78.7 | 4.1 | 8.8 | 6.1 | 2.3 |
West Berkshire | 91.9 | 2.4 | 3.7 | 1.3 | 0.7 |
West Devon | 97.8 | 1.1 | 0.6 | 0.2 | 0.3 |
West Lancashire | 96.9 | 1.3 | 1 | 0.3 | 0.4 |
West Lindsey | 97 | 1.1 | 1.2 | 0.3 | 0.4 |
West Northamptonshire | 85.9 | 2.8 | 5.3 | 4.9 | 1.1 |
West Oxfordshire | 95.2 | 1.9 | 1.7 | 0.6 | 0.6 |
West Suffolk District | 91.8 | 2.7 | 2.6 | 1.6 | 1.3 |
Westminster | 55.2 | 6.5 | 16.8 | 8.1 | 13.5 |
Wigan | 95 | 1.3 | 1.8 | 1.2 | 0.7 |
Wiltshire | 94.3 | 1.7 | 2.1 | 1.1 | 0.7 |
Winchester | 93.6 | 2 | 3.1 | 0.6 | 0.7 |
Windsor and Maidenhead | 79.8 | 3.4 | 13.1 | 1.5 | 2.1 |
Wirral | 95.2 | 1.5 | 2.3 | 0.4 | 0.6 |
Woking | 78.4 | 3.5 | 14.2 | 1.8 | 2.1 |
Wokingham | 79.9 | 3.1 | 12.9 | 2.4 | 1.6 |
Wolverhampton | 60.6 | 5.3 | 21.2 | 9.3 | 3.6 |
Worcester | 90 | 2.2 | 5.6 | 1.2 | 1 |
Worthing | 91.4 | 2.6 | 3.9 | 1.2 | 1 |
Wychavon | 96.9 | 1.2 | 1.1 | 0.3 | 0.5 |
Wyre | 97.5 | 1 | 1 | 0.2 | 0.3 |
Wyre Forest | 95.9 | 1.4 | 1.9 | 0.4 | 0.4 |
York | 92.8 | 1.8 | 3.8 | 0.7 | 1 |
The terms multiracial people or mixed-race people are used to refer to people who are of more than one race and the terms multi-ethnic people or ethnically-mixed people are used to refer to people who are of more than one ethnicity. A variety of terms have been used both historically and presently for mixed race people in a variety of contexts, including multiethnic, polyethnic, occasionally bi-ethnic, Métis, Muwallad, Colored, Dougla, half-caste, ʻafakasi, mestizo, mutt, Melungeon, quadroon, octoroon, sambo/zambo, Eurasian, hapa, hāfu, Garifuna, pardo, and Gurans. A number of these terms are now considered offensive, in addition to those that were initially coined for pejorative use. "Melezi" are called the offspring of Muslim Romani men and woman of host populations.
A nationwide census, known as Census 2001, was conducted in the United Kingdom on Sunday, 29 April 2001. This was the 20th UK census and recorded a resident population of 58,789,194.
The United States has a racially and ethnically diverse population. At the federal level, race and ethnicity have been categorized separately. The most recent United States census recognized seven racial categories, as well as people who belong to two or more of the racial categories. The United States also recognizes the broader notion of ethnicity. The 2000 census and 2010 American Community Survey inquired about the "ancestry" of residents, whilst the 2020 census allowed people to enter their “origins”. The Census Bureau also classified respondents as "Hispanic or Latino" or "Not Hispanic or Latino", identifying as an ethnicity, which comprises the largest minority group in the nation.
Self defined ethnicity (SDE) codes are a set of codes used by the Home Office in the United Kingdom to classify an individual's ethnicity according to that person's self-definition.
The demography of London is analysed by the Office for National Statistics and data is produced for each of the Greater London wards, the City of London and the 32 London boroughs, the Inner London and Outer London statistical sub-regions, each of the Parliamentary constituencies in London, and for all of Greater London as a whole. Additionally, data is produced for the Greater London Urban Area. Statistical information is produced about the size and geographical breakdown of the population, the number of people entering and leaving country and the number of people in each demographic subgroup. The total population of London as of 2021 is 8,799,800.
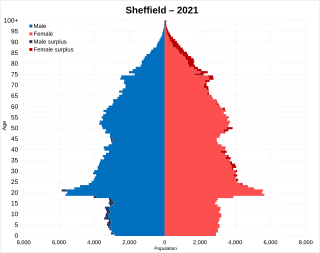
The latest (2021) population estimate for the City of Sheffield is 556,521 residents. This represents an increase of about 17,000 people since the last census in 2011.
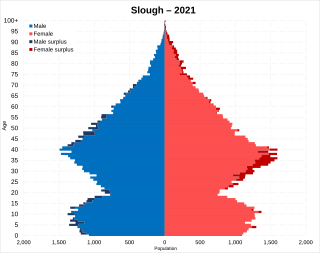
This article is intended to give an overview of the demography of Slough. In 2016, Slough had a population of 149,000 people.
Mixed is an ethnic group category that was first introduced by the United Kingdom's Office for National Statistics for the 2001 Census. Colloquially it refers to British citizens or residents whose parents are of two or more different races or ethnic backgrounds. The Mixed or Multiple ethnic group in England and Wales numbered 1.7 million in the 2021 census, 2.9% of the population.
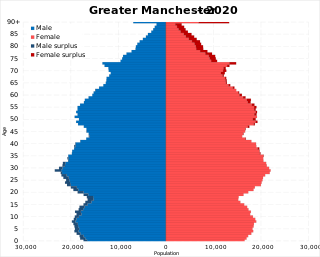
The demography of Greater Manchester is analysed by the Office for National Statistics and data is produced for each of its ten metropolitan boroughs, each of the Greater Manchester electoral wards, the NUTS3 statistical sub-regions, each of the Parliamentary constituencies in Greater Manchester, the 15 civil parishes in Greater Manchester, and for all of Greater Manchester as a whole; the latter of which had a population of 2,682,500 at the 2011 UK census. Additionally, data is produced for the Greater Manchester Urban Area. Statistical information is produced about the size and geographical breakdown of the population, the number of people entering and leaving country and the number of people in each demographic subgroup.
A number of different systems of classification of ethnicity in the United Kingdom exist. These schemata have been the subject of debate, including about the nature of ethnicity, how or whether it can be categorised, and the relationship between ethnicity, race, and nationality.
The English county of Cumbria is located in North West England and has a population of 496,200. Cumbria has an area of 6,768 km², making the county England's third largest county, and with only 73 inhabitants per km², it is the country's second least densely populated county. People from Cumbria are known as Cumbrians and they speak a variety of the Cumbrian dialect to the north, whilst a Lancashire accent is more prominent in the south. Along with Lancashire to the south, Cumbria is bordered with Scotland to the north, the Irish Sea to the west, Northumberland to the north-east, County Durham to the east and North Yorkshire to the south-east.
Roxwell is a village and civil parish in the Chelmsford district of Essex, England. The village is approximately 4 miles (6 km) west from the centre of the county town of Chelmsford, and to the south of the A1060 road, on which are the parish hamlets of Boyton Cross and Chalk End. Further Roxwell hamlets are Peppers Green at the north of the parish and Radley Green at the south.
Cornwall is a unitary authority and ceremonial county of England in the United Kingdom. At the 2011 census it had a population of 532,000. Cornwall is the homeland of the Cornish people, and many within Cornwall identify with a Cornish ethnic or national identity, although, due to Cornwall's political status as part of England and the United Kingdom, as well as in-migration from other parts of the UK and EU, additional identities such as English, British, and European may also be adopted.
Leicester, England is an ethnically and culturally diverse city. It is the thirteenth most populous city in the United Kingdom.
Nottingham, England is an ethnically and culturally diverse city. It is the sixteenth most populous city in the United Kingdom.
Luton, Bedfordshire, England is an ethnically and culturally diverse town of 203,201 people. It's primarily urban, with a population density of 4,696/km2 (12,160/sq mi). Luton has seen several waves of immigration. In the early part of the 20th century, there was internal migration of Irish and Scottish people to the town. These were followed by Afro-Caribbean and Asian immigrants. More recently immigrants from other European Union countries have made Luton their home. As a result of this Luton has a diverse ethnic mix, with a significant population of Asian descent, mainly Pakistani 29,353 (14.4%) and Bangladeshi 13,606 (6.7%).
Bradford, England is an ethnically and culturally diverse city. The City of Bradford metropolitan borough is the sixth most populous local authority district in the United Kingdom, and includes not only Bradford but also the towns and villages of Keighley, Shipley, Bingley, Ilkley, Haworth, Silsden, Queensbury, Thornton and Denholme.
Leeds, England is the third most populous city in the United Kingdom.
Bristol, England is the tenth most populous city in the United Kingdom.
Coventry, England is an ethnically and culturally diverse city. It is the fifteenth most populous city in the United Kingdom.