| |||||||||||||||||||
All 35 seats in the Idaho Senate 18 seats needed for a majority | |||||||||||||||||||
---|---|---|---|---|---|---|---|---|---|---|---|---|---|---|---|---|---|---|---|
| |||||||||||||||||||
Map of the incumbents: Democratic incumbent Republican incumbent | |||||||||||||||||||
|
Elections in Idaho |
---|
The 2024 Idaho Senate election will be held on November 5, 2024, alongside the 2024 United States elections. [1] For the first time in thirty years, the Idaho Democratic Party is running candidates in each legislative district on the ballot. [2]
Five incumbent senators, all Republicans, were defeated in the May 21 primary election. [4]
District 1 • District 2 • District 3 • District 4 • District 5 • District 6 • District 7 • District 8 • District 9 • District 10 • District 11 • District 12 • District 13 • District 14 • District 15 • District 16 • District 17 • District 18 • District 19 • District 20 • District 21 • District 22 • District 23 • District 24 • District 25 • District 26 • District 27 • District 28 • District 29 • District 30 • District 31 • District 32 • District 33 • District 34 • District 35 |
Party | Candidate | Votes | % | |
---|---|---|---|---|
Republican | Jim Woodward | 8,219 | 51.94 | |
Republican | Scott Herndon (incumbent) | 7,606 | 48.06 | |
Total votes | 15,825 | 100.0 |
Party | Candidate | Votes | % | |
---|---|---|---|---|
Republican | Jim Woodward | |||
Independent | Steve Johnson | |||
Independent | Dan Rose | |||
Total votes |
Party | Candidate | Votes | % | |
---|---|---|---|---|
Republican | Phil Hart (incumbent) | 7,503 | 100 | |
Total votes | 7,503 | 100.0 |
Party | Candidate | Votes | % | |
---|---|---|---|---|
Democratic | Tom Hearn | 891 | 100.0 | |
Total votes | 891 | 100.0 |
Party | Candidate | Votes | % | |
---|---|---|---|---|
Republican | Phil Hart (incumbent) | |||
Democratic | Tom Hearn | |||
Total votes |
Party | Candidate | Votes | % | |
---|---|---|---|---|
Republican | Doug Okuniewicz (incumbent) | 8,830 | 100 | |
Total votes | 8,830 | 100.0 |
Party | Candidate | Votes | % | |
---|---|---|---|---|
Democratic | Brian Seguin | 732 | 100.0 | |
Total votes | 732 | 100.0 |
Party | Candidate | Votes | % | |
---|---|---|---|---|
Republican | Doug Okuniewicz (incumbent) | |||
Democratic | Brian Seguin | |||
Total votes |
Party | Candidate | Votes | % | |
---|---|---|---|---|
Republican | Ben Toews (incumbent) | 5,374 | 100 | |
Total votes | 5,374 | 100.0 |
Party | Candidate | Votes | % | |
---|---|---|---|---|
Democratic | Carissa Hober | 1,037 | 100.0 | |
Total votes | 1,037 | 100.0 |
Party | Candidate | Votes | % | |
---|---|---|---|---|
Republican | Ben Toews (incumbent) | |||
Democratic | Carissa Hober | |||
Total votes |
Party | Candidate | Votes | % | |
---|---|---|---|---|
Republican | Carl Bjerke (incumbent) | 5,827 | 77.50 | |
Republican | Cheri Zao | 1,692 | 22.50 | |
Total votes | 7,519 | 100.0 |
Party | Candidate | Votes | % | |
---|---|---|---|---|
Democratic | Adam Chapman | 581 | 100.0 | |
Total votes | 581 | 100.0 |
Party | Candidate | Votes | % | |
---|---|---|---|---|
Republican | Carl Bjerke (incumbent) | |||
Democratic | Adam Chapman | |||
Total votes |
Party | Candidate | Votes | % | |
---|---|---|---|---|
Republican | Dan Foreman (incumbent) | 3,396 | 53.24 | |
Republican | Robert Blair | 2,983 | 46.76 | |
Total votes | 6,379 | 100.0 |
Party | Candidate | Votes | % | |
---|---|---|---|---|
Democratic | Julia Parker | 1,086 | 100.0 | |
Total votes | 1,086 | 100.0 |
Party | Candidate | Votes | % | |
---|---|---|---|---|
Republican | Dan Foreman (incumbent) | |||
Democratic | Julia Parker | |||
Total votes |
Party | Candidate | Votes | % | |
---|---|---|---|---|
Republican | Cindy Carlson (incumbent) | 6,444 | 100 | |
Total votes | 6,444 | 100.0 |
Party | Candidate | Votes | % | |
---|---|---|---|---|
Democratic | Bill Farmer | 842 | 100.0 | |
Total votes | 842 | 100.0 |
Party | Candidate | Votes | % | |
---|---|---|---|---|
Republican | Cindy Carlson (incumbent) | |||
Democratic | Bill Farmer | |||
Total votes |
Party | Candidate | Votes | % | |
---|---|---|---|---|
Republican | Christy Zito | 4,862 | 56.35 | |
Republican | Geoff Schroeder (incumbent) | 3,766 | 43.65 | |
Total votes | 8,628 | 100.0 |
Party | Candidate | Votes | % | |
---|---|---|---|---|
Democratic | David Hoag | 790 | 100.0 | |
Total votes | 790 | 100.0 |
Party | Candidate | Votes | % | |
---|---|---|---|---|
Republican | Christy Zito | |||
Democratic | David Hoag | |||
Total votes |
Party | Candidate | Votes | % | |
---|---|---|---|---|
Republican | Brandon Shippy | 4,404 | 51.70 | |
Republican | Scott Syme | 4,114 | 48.30 | |
Total votes | 8,518 | 100.0 |
Party | Candidate | Votes | % | |
---|---|---|---|---|
Democratic | Rachel Buck | 412 | 100.0 | |
Total votes | 412 | 100.0 |
Party | Candidate | Votes | % | |
---|---|---|---|---|
Republican | Brandon Shippy | |||
Democratic | Rachel Buck | |||
Total votes |
Party | Candidate | Votes | % | |
---|---|---|---|---|
Republican | Tammy Nichols (incumbent) | 5,915 | 64.11 | |
Republican | Lori Bishop | 3,311 | 35.89 | |
Total votes | 9,226 | 100.0 |
Party | Candidate | Votes | % | |
---|---|---|---|---|
Democratic | Letishia Silva | 666 | 100.0 | |
Total votes | 666 | 100.0 |
Party | Candidate | Votes | % | |
---|---|---|---|---|
Republican | Tammy Nichols (incumbent) | |||
Democratic | Letishia Silva | |||
Total votes |
Party | Candidate | Votes | % | |
---|---|---|---|---|
Republican | Camille Blaylock | 1,746 | 51.92 | |
Republican | Chris Trakel (incumbent) | 1,617 | 48.08 | |
Total votes | 3,363 | 100.0 |
Party | Candidate | Votes | % | |
---|---|---|---|---|
Democratic | Toni Fero | 495 | 100.0 | |
Total votes | 495 | 100.0 |
Party | Candidate | Votes | % | |
---|---|---|---|---|
Republican | Camille Blaylock | |||
Democratic | Toni Fero | |||
Total votes |
Party | Candidate | Votes | % | |
---|---|---|---|---|
Republican | Ben Adams | 2,580 | 57.58 | |
Republican | Victor Rodriguez | 1,901 | 42.42 | |
Total votes | 4,481 | 100.0 |
Party | Candidate | Votes | % | |
---|---|---|---|---|
Republican | Ben Adams | |||
Republican hold | ||||
Party | Candidate | Votes | % | |
---|---|---|---|---|
Republican | Brian Lenney (incumbent) | 2,695 | 55.58 | |
Republican | Jeff Agenbroad | 2,154 | 44.42 | |
Total votes | 4,849 | 100.0 |
Party | Candidate | Votes | % | |
---|---|---|---|---|
Democratic | Sarah Butler | 492 | 100.0 | |
Total votes | 492 | 100.0 |
Party | Candidate | Votes | % | |
---|---|---|---|---|
Republican | Brian Lenney (incumbent) | |||
Democratic | Sarah Butler | |||
Total votes |
Party | Candidate | Votes | % | |
---|---|---|---|---|
Republican | C. Scott Grow (incumbent) | 6,585 | 100 | |
Total votes | 6,585 | 100.0 |
Party | Candidate | Votes | % | |
---|---|---|---|---|
Constitution | Kirsten Faith Richardson | 8 | 100.0 | |
Total votes | 8 | 100.0 |
Party | Candidate | Votes | % | |
---|---|---|---|---|
Republican | C. Scott Grow (incumbent) | |||
Constitution | Kirsten Faith Richardson | |||
Total votes |
Party | Candidate | Votes | % | |
---|---|---|---|---|
Republican | Codi Galloway | 3,286 | 100 | |
Total votes | 3,286 | 100.0 |
Party | Candidate | Votes | % | |
---|---|---|---|---|
Democratic | Rick Just (incumbent) | 1,753 | 100.0 | |
Total votes | 1,753 | 100.0 |
Party | Candidate | Votes | % | |
---|---|---|---|---|
Republican | Codi Galloway | |||
Democratic | Rick Just (incumbent) | |||
Total votes |
Party | Candidate | Votes | % | |
---|---|---|---|---|
Republican | LeeJoe Lay | 2,145 | 100 | |
Total votes | 2,145 | 100.0 |
Party | Candidate | Votes | % | |
---|---|---|---|---|
Democratic | Alison Rabe (incumbent) | 2,503 | 88.95 | |
Democratic | Justin "Justice" Miston | 311 | 11.05 | |
Total votes | 2,814 | 100.0 |
Party | Candidate | Votes | % | |
---|---|---|---|---|
Republican | LeeJoe Lay | |||
Democratic | Alison Rabe (incumbent) | |||
Total votes |
Party | Candidate | Votes | % | |
---|---|---|---|---|
Republican | Benjamin D. Chafetz | 2,185 | 100 | |
Total votes | 2,185 | 100.0 |
Party | Candidate | Votes | % | |
---|---|---|---|---|
Democratic | Carrie Semmelroth (incumbent) | 1,367 | 100 | |
Total votes | 1,367 | 100.0 |
Party | Candidate | Votes | % | |
---|---|---|---|---|
Republican | Benjamin D. Chafetz | |||
Democratic | Carrie Semmelroth (incumbent) | |||
Total votes |
Party | Candidate | Votes | % | |
---|---|---|---|---|
Republican | Dan Bridges | 2,245 | 100 | |
Total votes | 2,245 | 100.0 |
Party | Candidate | Votes | % | |
---|---|---|---|---|
Democratic | Janie Ward-Engelking (incumbent) | 1,560 | 100 | |
Total votes | 1,560 | 100.0 |
Party | Candidate | Votes | % | |
---|---|---|---|---|
Republican | Dan Bridges | |||
Democratic | Janie Ward-Engelking (incumbent) | |||
Total votes |
Party | Candidate | Votes | % | |
---|---|---|---|---|
Democratic | Melissa Wintrow (incumbent) | 2,293 | 100 | |
Total votes | 2,293 | 100.0 |
Party | Candidate | Votes | % | |
---|---|---|---|---|
Democratic | Melissa Wintrow (incumbent) | |||
Democratic hold | ||||
Party | Candidate | Votes | % | |
---|---|---|---|---|
Republican | Josh Keyser | 3,207 | 52.29 | |
Republican | Chuck Winder (incumbent) | 2,926 | 47.71 | |
Total votes | 6,133 | 100.0 |
Party | Candidate | Votes | % | |
---|---|---|---|---|
Democratic | Andy Arriaga | 955 | 100.0 | |
Total votes | 955 | 100.0 |
Party | Candidate | Votes | % | |
---|---|---|---|---|
Republican | Josh Keyser | |||
Democratic | Andy Arriaga | |||
Total votes |
Party | Candidate | Votes | % | |
---|---|---|---|---|
Republican | Treg Bernt (incumbent) | 3,235 | 59.31 | |
Republican | Brenda Bourn | 2,219 | 40.69 | |
Total votes | 5,454 | 100.0 |
Party | Candidate | Votes | % | |
---|---|---|---|---|
Libertarian Party of Idaho | Mike Long | 26 | 100.0 | |
Total votes | 26 | 100.0 |
Party | Candidate | Votes | % | |
---|---|---|---|---|
Republican | Treg Bernt (incumbent) | |||
Libertarian Party of Idaho | Mike Long | |||
Total votes |
Party | Candidate | Votes | % | |
---|---|---|---|---|
Republican | Lori Den Hartog (incumbent) | 4,078 | 100 | |
Total votes | 4,078 | 100.0 |
Party | Candidate | Votes | % | |
---|---|---|---|---|
Democratic | Dawn Pierce | 1,085 | 100 | |
Total votes | 1,085 | 100.0 |
Party | Candidate | Votes | % | |
---|---|---|---|---|
Republican | Lori Den Hartog (incumbent) | |||
Democratic | Dawn Pierce | |||
Total votes |
Party | Candidate | Votes | % | |
---|---|---|---|---|
Republican | Todd Lakey (incumbent) | 5,608 | 100 | |
Total votes | 5,608 | 100.0 |
Party | Candidate | Votes | % | |
---|---|---|---|---|
Democratic | Paul Morgan | 469 | 100 | |
Total votes | 469 | 100.0 |
Party | Candidate | Votes | % | |
---|---|---|---|---|
Constitution | Paul Smith | 21 | 100 | |
Total votes | 21 | 100.0 |
Party | Candidate | Votes | % | |
---|---|---|---|---|
Republican | Todd Lakey (incumbent) | |||
Democratic | Paul Morgan | |||
Constitution | Paul Smith | |||
Total votes |
Party | Candidate | Votes | % | |
---|---|---|---|---|
Republican | Glenneda Zuiderveld (incumbent) | 4,923 | 54.59 | |
Republican | Alex Caval | 4,095 | 45.41 | |
Total votes | 9,018 | 100.0 |
Party | Candidate | Votes | % | |
---|---|---|---|---|
Democratic | Edward Easterling | 318 | 100.0 | |
Total votes | 318 | 100.0 |
Party | Candidate | Votes | % | |
---|---|---|---|---|
Republican | Glenneda Zuiderveld (incumbent) | |||
Democratic | Edward Easterling | |||
Total votes |
Party | Candidate | Votes | % | |
---|---|---|---|---|
Republican | Josh Kohl | 3,008 | 63.07 | |
Republican | Linda Wright Hartgen (incumbent) | 1,761 | 36.93 | |
Total votes | 4,769 | 100.0 |
Party | Candidate | Votes | % | |
---|---|---|---|---|
Democratic | W. Lane Startin | 380 | 100.0 | |
Total votes | 380 | 100.0 |
Party | Candidate | Votes | % | |
---|---|---|---|---|
Republican | Josh Kohl | |||
Democratic | W. Lane Startin | |||
Total votes |
Party | Candidate | Votes | % | |
---|---|---|---|---|
Republican | Laurie Lickley | 3,253 | 100 | |
Total votes | 3,253 | 100.0 |
Party | Candidate | Votes | % | |
---|---|---|---|---|
Democratic | Ron Taylor (incumbent) | 3,153 | 100 | |
Total votes | 3,153 | 100.0 |
Party | Candidate | Votes | % | |
---|---|---|---|---|
Republican | Laurie Lickley | |||
Democratic | Ron Taylor (incumbent) | |||
Independent | Kala Tate | |||
Total votes |
Party | Candidate | Votes | % | |
---|---|---|---|---|
Republican | Kelly Anthon (incumbent) | 5,910 | 100 | |
Total votes | 5,910 | 100.0 |
Party | Candidate | Votes | % | |
---|---|---|---|---|
Democratic | Damian Rogriguez | 209 | 100 | |
Total votes | 209 | 100.0 |
Party | Candidate | Votes | % | |
---|---|---|---|---|
Republican | Kelly Anthon (incumbent) | |||
Democratic | Damian Rodriguez | |||
Total votes |
Party | Candidate | Votes | % | |
---|---|---|---|---|
Republican | Jim Guthrie (incumbent) | 6,118 | 100 | |
Total votes | 6,118 | 100.0 |
Party | Candidate | Votes | % | |
---|---|---|---|---|
Democratic | Russell "Russ" Matter | 552 | 100 | |
Total votes | 552 | 100.0 |
Party | Candidate | Votes | % | |
---|---|---|---|---|
Republican | Jim Guthrie (incumbent) | |||
Democratic | Russell "Russ" Matter | |||
Total votes |
Party | Candidate | Votes | % | |
---|---|---|---|---|
Democratic | James Ruchti (incumbent) | 1,155 | 100 | |
Total votes | 1,155 | 100.0 |
Party | Candidate | Votes | % | |
---|---|---|---|---|
Democratic | James Ruchti (incumbent) | |||
Democratic hold | ||||
Party | Candidate | Votes | % | |
---|---|---|---|---|
Republican | Julie VanOrden (incumbent) | 4,765 | 63.14 | |
Republican | Jerry Truth Bingham | 2,782 | 36.86 | |
Total votes | 7.547 | 100.0 |
Party | Candidate | Votes | % | |
---|---|---|---|---|
Democratic | Karen Keith | 286 | 100.0 | |
Total votes | 286 | 100.0 |
Party | Candidate | Votes | % | |
---|---|---|---|---|
Republican | Julie VanOrden (incumbent) | |||
Democratic | Karen Keith | |||
Total votes |
Party | Candidate | Votes | % | |
---|---|---|---|---|
Republican | Van Burtenshaw (incumbent) | 8,788 | 100 | |
Total votes | 8,788 | 100.0 |
Party | Candidate | Votes | % | |
---|---|---|---|---|
Democratic | Dean Martonen | 395 | 100 | |
Total votes | 395 | 100.0 |
Party | Candidate | Votes | % | |
---|---|---|---|---|
Republican | Van Burtenshaw (incumbent) | |||
Democratic | Dean Martonen | |||
Total votes |
Party | Candidate | Votes | % | |
---|---|---|---|---|
Republican | Kevin Cook (incumbent) | 4,707 | 69.11 | |
Republican | Keith Newberry | 2,104 | 30.89 | |
Total votes | 6,811 | 100.0 |
Party | Candidate | Votes | % | |
---|---|---|---|---|
Republican | Kevin Cook (incumbent) | |||
Republican hold | ||||
Party | Candidate | Votes | % | |
---|---|---|---|---|
Republican | Dave Lent (incumbent) | 2,580 | 60.08 | |
Republican | Bryan Scholz | 1,714 | 39.92 | |
Total votes | 4,294 | 100.0 |
Party | Candidate | Votes | % | |
---|---|---|---|---|
Republican | Dave Lent (incumbent) | |||
Total votes | ||||
Republican hold | ||||
Party | Candidate | Votes | % | |
---|---|---|---|---|
Republican | Doug Ricks (incumbent) | 3,587 | 100 | |
Total votes | 3,587 | 100.0 |
Party | Candidate | Votes | % | |
---|---|---|---|---|
Democratic | Marsha Craner | 129 | 100.0 | |
Total votes | 129 | 100.0 |
Party | Candidate | Votes | % | |
---|---|---|---|---|
Republican | Doug Ricks (incumbent) | |||
Democratic | Marsha Craner | |||
Total votes |
Party | Candidate | Votes | % | |
---|---|---|---|---|
Republican | Mark Harris | 5,033 | 62.25 | |
Republican | Doug Toomer | 3,052 | 37.75 | |
Total votes | 8.085 | 100.0 |
Party | Candidate | Votes | % | |
---|---|---|---|---|
Democratic | Chris Riley | 489 | 100.0 | |
Total votes | 489 | 100.0 |
Party | Candidate | Votes | % | |
---|---|---|---|---|
Republican | Mark Harris | |||
Democratic | Chris Riley | |||
Total votes |
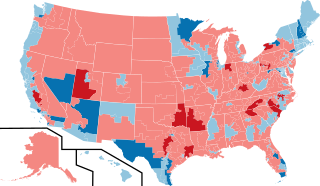
The 2014 United States Senate elections were held on November 4, 2014. A total of 36 seats in the 100-member U.S. Senate were contested. Thirty-three Class 2 seats were contested for regular six-year terms to be served from January 3, 2015, to January 3, 2021, and three Class 3 seats were contested in special elections due to Senate vacancies. The elections marked 100 years of direct elections of U.S. senators. Going into the elections, 21 of the contested seats were held by the Democratic Party, while 15 were held by the Republican Party.
The 2012 United States House of Representatives elections were held on November 6, 2012. It coincided with the reelection of President Barack Obama. Elections were held for all 435 seats representing the 50 U.S. states and also for the delegates from the District of Columbia and five major U.S. territories. The winners of this election cycle served in the 113th United States Congress. This was the first congressional election using districts drawn up based on the 2010 United States census.
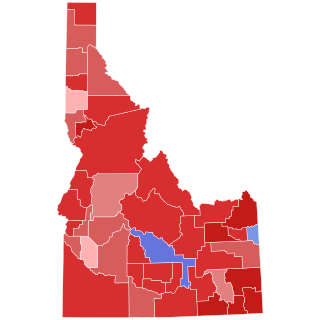
A general election was held in the U.S. state of Idaho on November 4, 2014. All of Idaho's executive officers are up for election as well as a United States Senate seat, and both of Idaho's two seats in the United States House of Representatives. Primary elections was held on May 20, 2014.
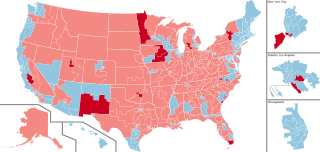
The 2016 United States House of Representatives elections were held on November 8, 2016, to elect representatives for all 435 congressional districts across each of the 50 U.S. states to the 115th United States Congress. Non-voting members for the District of Columbia and territories of the United States were also elected. These elections coincided with the election of President Donald Trump, although his party lost seats in both chambers of Congress. The winners of this election served in the 115th Congress, with seats apportioned among the states based on the 2010 United States census. In October 2015, the House elected a new Speaker, Republican Paul Ryan, who was re-elected in the new term. Democrat Nancy Pelosi continued to lead her party as Minority Leader. Elections were also held on the same day for the U.S. Senate, many governors, and other state and local elections.
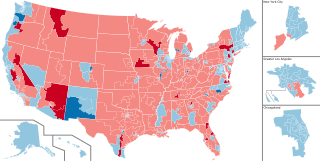
The 2018 United States House of Representatives elections were held on November 6, 2018, as part of the 2018 midterm elections during President Donald Trump's term, with early voting taking place in some states in the weeks preceding that date. Voters chose representatives from all 435 congressional districts across each of the 50 U.S. states to serve in the 116th United States Congress. Non-voting delegates from the District of Columbia and four of the five inhabited U.S. territories were also elected. On Election Day, Republicans had held a House majority since January 2011.
The 2020 United States House of Representatives elections were held on November 3, 2020, to elect representatives from all 435 congressional districts across each of the 50 U.S. states to the 117th United States Congress, as well as six non-voting delegates from the District of Columbia and the inhabited U.S. territories. Special House elections were also held on various dates throughout 2020.
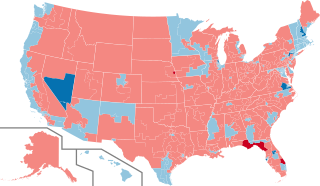
The 2022 United States House of Representatives elections were held on November 8, 2022, as part of the 2022 United States elections during incumbent president Joe Biden's term. Representatives were elected from all 435 U.S. congressional districts across each of the 50 states to serve in the 118th United States Congress, as well as 5 non-voting members of the U.S. House of Representatives from the District of Columbia and four of the five inhabited insular areas. Numerous other federal, state, and local elections, including the 2022 U.S. Senate elections and the 2022 U.S. gubernatorial elections, were also held simultaneously. This was the first election after the 2020 redistricting cycle.
The 2022 United States Senate election in Idaho was held on November 8, 2022 to elect a member of the United States Senate to represent the state of Idaho.
The 2018 West Virginia Senate elections were held on November 6, 2018, as part of the biennial United States elections. Seventeen of West Virginia's 34 state senators were up for election. West Virginia Senate districts each have two elected representatives. State senators serve staggered four-year terms in West Virginia, with one senator from each district up in even-numbered years corresponding to presidential election years, and the other up in even-numbered years corresponding to presidential midterm years.
The 2021 Virginia House of Delegates election for the 162nd Virginia General Assembly were held on November 2, 2021 to coincide with biennial elections in the U.S. state of Virginia. All 100 Delegates are elected to two-year terms in single-member constituencies. Primary elections took place on June 8. This election coincided with the 2021 Virginia Gubernatorial election, the Lieutenant Gubernatorial election, and lastly, the Attorney General election, all of which were won by Republicans. The upper house of the Virginia General Assembly, the Senate of Virginia, will hold its next election on November 7, 2023.
The 2022 elections for the Pennsylvania House of Representatives were held on November 8, 2022, with all districts currently being decided. The term of office for those elected in 2022 began when the House of Representatives convened in January 2023. Pennsylvania State Representatives are elected for two-year terms, with all 203 seats up for election every two years.
The 2022 New York State Assembly election was held on November 8, 2022. Elections were held to elect representatives from all 150 districts across the State of New York. This election coincided with New York elections for the governorship, U.S. Senate, and state senate, among others. Districts for this election were redrawn following the 2020 United States census. Democrats have held a majority in the New York State Assembly since 1975.
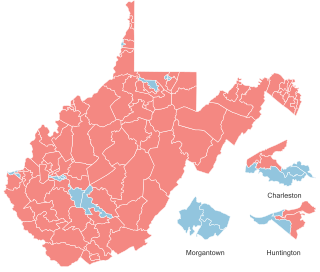
The 2022 West Virginia House of Delegates election was held on November 8, 2022, electing all 100 members of the chamber. This coincided with the election of 17 of West Virginia's 34 state senators, and the election of West Virginia's two U.S. representatives. Primary elections were held on May 10, 2022. Due to redistricting, this was the first House of Delegates election in which all members were elected from single member districts, with West Virginia following a trend of states phasing out multi-member districts in recent decades.
The 2022 South Carolina House of Representatives election took place on November 8, 2022, as part of the biennial United States elections. South Carolina voters elected state representatives in all 124 of the state's house districts. Republicans flipped eight seats held by Democrats, while Democrats flipped one seat held by a Republican; with their majority expanded by a net gain of seven seats, Republicans achieved a supermajority in the chamber.
The 2022 Maryland House of Delegates election was held on November 8, 2022, electing all 141 members of the chamber. This coincided with the election of all 47 of Maryland's state senators, along with other statewide offices. The Democratic and Republican primaries were held on July 19, 2022.
The 2023 Virginia Senate election was held on Tuesday, November 7, 2023, concurrently with elections for the Virginia House of Delegates, to elect senators to all 40 seats in the Senate of Virginia for the 163rd and 164th Virginia Assembly. Nomination primaries held through the Department of Elections were held June 20, 2023. These were the first elections held following redistricting as a result of the 2020 census.
The 2024 United States House of Representatives elections will be held on November 5, 2024, as part of the 2024 United States elections, to elect representatives from all 435 congressional districts across each of the 50 U.S. states, as well as 6 non-voting delegates from the District of Columbia and the inhabited U.S. territories. Special elections may also be held on various dates throughout 2024. Numerous other federal, state, and local elections, including the U.S. presidential election and elections to the Senate, will also be held on this date. The winners of this election will serve in the 119th United States Congress, with seats apportioned among the states based on the 2020 United States census.
The 2024 elections for the Pennsylvania House of Representatives will be held on November 5, 2024, with all districts up for election. The term of office for those elected in 2024 will begin when the House of Representatives convenes in January 2025. Pennsylvania State Representatives are elected for two-year terms, with all 203 seats up for election every two years. The primary elections to choose the respective parties' nominees will take place on April 23.
Following statewide primaries held on March 5, 2024, the 2024 Texas House of Representatives election will be held on November 5, 2024. The winners of this election will serve in the 89th Texas Legislature. It will be held alongside numerous other federal, state, and local elections, including the 2024 U.S. presidential election and the 2024 Texas Senate election.
The 2024 Idaho House of Representatives election will be held on November 5, 2024, alongside the 2024 United States elections. For the first time in thirty years, the Idaho Democratic Party is running candidates in each legislative district on the ballot.