Greater Boston

Last updated

Greater Boston
Boston Skyline (pano) (19806818856).jpg
Boston in July 2015
Greater Boston
Interactive Map of Boston–Worcester–Providence, MA–RI–NH CSA
Country Flag of United States.svg United States
State Flag of Massachusetts.svg Massachusetts
Flag of Rhode Island.svg Rhode Island
Flag of New Hampshire.svg New Hampshire
Principal cities
Population
 (2020)
  Total8,466,186 (CSA)
4,941,632 (MSA)
  Rank
GDP
[1]
  Boston (MSA)$504.1 billion (2022)
Time zone UTC−5 (EST)
  Summer (DST) UTC−4 (EDT)
Area code(s) 617, 781, 857, 339, 978, 508, 351, 774, 603, 401

Greater Boston is the metropolitan region of New England encompassing the municipality of Boston, the capital of the U.S. state of Massachusetts and the most populous city in New England, and its surrounding areas. The most stringent definition of the region consists of most of the eastern third of mainland Massachusetts, excluding the Merrimack Valley and most of Southeastern Massachusetts, though most definitions (including the US Census definition) include much of these areas and portions of southern New Hampshire. [2]

Contents

While the city of Boston covers 48.4 square miles (125 km2) and has 675,647 residents as of the 2020 census, the urbanization has extended well into surrounding areas and the Combined Statistical Area (CSA in the rest of the document), which includes the Providence, Rhode Island, Manchester, New Hampshire, Cape Cod and Worcester areas, has a population of more than 8.4 million people, making it one of the most populous such regions in the U.S.

Some of Greater Boston's most well-known contributions involve the region's higher education and medical institutions. Greater Boston has been influential upon American history and industry. The region and the state of Massachusetts are global leaders in biotechnology, artificial intelligence, [2] engineering, higher education, finance, and maritime trade. [3]

Greater Boston is ranked tenth in population among US metropolitan statistical areas, home to 4,941,632 people as of the 2020 United States Census, and sixth among combined statistical areas, with a population of 8,466,186. The area has hosted many people and sites significant to American culture and history, particularly American literature, [4] politics, and the American Revolution.

Plymouth was the site of the first colony in New England, founded in 1620 by the Pilgrims, passengers of the Mayflower . In 1692, the town of Salem and surrounding areas experienced one of America's most infamous cases of mass hysteria, the Salem witch trials. [5] In the late 18th century, Boston became known as the "Cradle of Liberty" [6] for the agitation there that led to the American Revolution.

The Greater Boston region has played a powerful scientific, commercial, and cultural role in the history of the United States. Before the American Civil War, the region was a center for the abolitionist, temperance, [7] and transcendentalist [8] movements. [9] In 2004, Massachusetts became the first U.S. state to legally recognize same-sex marriage as a result of the decision of the Massachusetts Supreme Judicial Court in Boston. [10] Many prominent American political dynasties have hailed from the Boston region, including the Adams and Kennedy families.

Harvard University in Cambridge is the oldest institution of higher learning in the United States, [11] with the largest financial endowment of any university, [12] and whose Law School has spawned a contemporaneous majority of United States Supreme Court Justices. [13] Kendall Square in Cambridge has been called "the most innovative square mile on the planet", in reference to the high concentration of entrepreneurial start-ups and quality of innovation which have emerged in the vicinity of the square since 2010. [14] [15] Both Harvard University and the Massachusetts Institute of Technology, also in Cambridge, have been ranked among the most highly regarded academic institutions in the world. [16]

Geography

Boundary definitions

Metropolitan Area

The most restrictive definition of the Greater Boston area is the region administered by the Metropolitan Area Planning Council. [17] The MAPC is a regional planning organization created by the Massachusetts legislature to oversee transportation infrastructure and economic development concerns in the Boston area. The MAPC includes 101 cities and towns that are grouped into eight subregions. These include most of the area within the region's outer circumferential highway, I-495. In 2013, the population of the MAPC district was 3.2 million, which was 48% of the total population of Massachusetts, [18] in an area of 1,422 square miles (3,680 km2), [17] of which 39% is forested and an additional 11% is water, wetland, or other open space. [19]

The cities and towns included in this definitions are: [20]

Metropolitan Area

Two definitions are used by the United States Census to define the Boston–Cambridge–Newton, MA–NH Metro Area or Boston–Cambridge–Newton, MA–NH Metropolitan NECTA, which is defined as a New England City and Town Area. [21] [22] The metro area definition is based on counties, while the NECTA definition is based on city and town boundaries. Counties included in the county-based definition include: [21]

The NECTA definition includes all of the communities from the MAPC definition, as well as the Merrimack Valley communities, parts of southern New Hampshire (northward to Milford and Hampton, and the Taunton area.

Historical population
CensusPop.Note
1850 650,357
1860 830,99827.8%
1870 978,34617.7%
1880 1,205,43923.2%
1890 1,515,68425.7%
1900 1,890,12224.7%
1910 2,260,76219.6%
1920 2,563,12313.4%
1930 2,866,56711.8%
1940 2,926,6502.1%
1950 3,186,9708.9%
1960 3,516,43510.3%
1970 3,918,09211.4%
1980 3,938,5850.5%
1990 4,133,8955.0%
2000 4,391,3446.2%
2010 4,552,4023.7%
2020 4,941,6328.5%
2022 (est.)4,900,550−0.8%
US Decennial Census
Cambridge and Boston with MIT and Kendall Square in the foreground and Boston's Financial District in the background MIT Charles River aerial.JPG
Cambridge and Boston with MIT and Kendall Square in the foreground and Boston's Financial District in the background

Combined Statistical Area

The widest definition of the metropolitan area based on commuting patterns, is defined by the U.S. Census as the Boston–Worcester–Providence combined statistical area. This area consists of the following counties in Connecticut, Massachusetts, Rhode Island, and New Hampshire: [23]

Downtown Providence, Rhode Island in 2008 Downtown Providence Rhode Island 2008.jpg
Downtown Providence, Rhode Island in 2008

The total population for the extended region was estimated at 8,466,186 at the 2020 census.[ citation needed ]

Subregions

Climate

The Boston area has humid continental climates (Dfa and Dfb under the Köppen climate classification system), with high humidity and precipitation year-round.

Climate data for Concord Municipal Airport, New Hampshire (1991−2020 normals, [lower-alpha 1] extremes 1868–present) [lower-alpha 2]
MonthJanFebMarAprMayJunJulAugSepOctNovDecYear
Record high °F (°C)72
(22)
74
(23)
89
(32)
95
(35)
98
(37)
101
(38)
102
(39)
101
(38)
98
(37)
92
(33)
80
(27)
73
(23)
102
(39)
Mean maximum °F (°C)52.4
(11.3)
54.3
(12.4)
65.6
(18.7)
81.6
(27.6)
89.6
(32.0)
92.8
(33.8)
93.8
(34.3)
92.4
(33.6)
89.0
(31.7)
79.0
(26.1)
68.6
(20.3)
56.9
(13.8)
96.1
(35.6)
Mean daily maximum °F (°C)31.6
(−0.2)
34.8
(1.6)
43.6
(6.4)
57.5
(14.2)
69.3
(20.7)
77.8
(25.4)
83.0
(28.3)
81.7
(27.6)
73.7
(23.2)
60.9
(16.1)
48.4
(9.1)
37.1
(2.8)
58.3
(14.6)
Daily mean °F (°C)22.3
(−5.4)
24.7
(−4.1)
33.4
(0.8)
45.4
(7.4)
56.7
(13.7)
65.8
(18.8)
71.1
(21.7)
69.5
(20.8)
61.4
(16.3)
49.3
(9.6)
38.6
(3.7)
28.3
(−2.1)
47.2
(8.4)
Mean daily minimum °F (°C)12.9
(−10.6)
14.7
(−9.6)
23.3
(−4.8)
33.3
(0.7)
44.1
(6.7)
53.7
(12.1)
59.2
(15.1)
57.2
(14.0)
49.0
(9.4)
37.8
(3.2)
28.7
(−1.8)
19.5
(−6.9)
36.1
(2.3)
Mean minimum °F (°C)−9.2
(−22.9)
−7.2
(−21.8)
1.6
(−16.9)
19.2
(−7.1)
29.2
(−1.6)
39.0
(3.9)
47.1
(8.4)
44.1
(6.7)
32.1
(0.1)
22.1
(−5.5)
11.8
(−11.2)
−0.9
(−18.3)
−12.4
(−24.7)
Record low °F (°C)−35
(−37)
−37
(−38)
−20
(−29)
4
(−16)
21
(−6)
26
(−3)
33
(1)
29
(−2)
20
(−7)
10
(−12)
−17
(−27)
−24
(−31)
−37
(−38)
Average precipitation inches (mm)2.80
(71)
2.75
(70)
3.28
(83)
3.43
(87)
3.47
(88)
3.77
(96)
3.62
(92)
3.63
(92)
3.63
(92)
4.43
(113)
3.44
(87)
3.70
(94)
41.95
(1,066)
Average snowfall inches (cm)17.1
(43)
16.9
(43)
13.6
(35)
2.5
(6.4)
0.0
(0.0)
0.0
(0.0)
0.0
(0.0)
0.0
(0.0)
0.0
(0.0)
0.8
(2.0)
2.5
(6.4)
14.3
(36)
67.7
(172)
Average extreme snow depth inches (cm)12
(30)
15
(38)
13
(33)
4
(10)
0
(0)
0
(0)
0
(0)
0
(0)
0
(0)
1
(2.5)
2
(5.1)
9
(23)
15
(38)
Average precipitation days (≥ 0.01 in)11.210.011.511.412.412.810.99.99.310.610.812.0132.8
Average snowy days (≥ 0.1 in)8.17.65.21.30.00.00.00.00.00.21.66.330.3
Average relative humidity (%)67.966.064.862.065.070.971.874.576.372.873.372.369.8
Average dew point °F (°C)10.2
(−12.1)
12.0
(−11.1)
20.8
(−6.2)
29.8
(−1.2)
42.1
(5.6)
53.8
(12.1)
58.8
(14.9)
57.9
(14.4)
50.5
(10.3)
38.3
(3.5)
28.8
(−1.8)
16.7
(−8.5)
35.0
(1.7)
Mean monthly sunshine hours 162.8171.8210.5223.2258.4274.3295.8261.9214.7183.4127.8134.82,519.4
Percent possible sunshine 56585756576064615754444856
Average ultraviolet index 1245788763215
Source 1: NOAA (snow depth 1991-2023, relative humidity , dew points and sun 1961–1990) [24] [25] [26]
Source 2: Weather Atlas (UV) [27]
MonthJanFebMarAprMayJunJulAugSepOctNovDecYear
Record high °F (°C)74
(23)
73
(23)
89
(32)
94
(34)
97
(36)
100
(38)
104
(40)
102
(39)
102
(39)
90
(32)
83
(28)
76
(24)
104
(40)
Mean maximum °F (°C)58.3
(14.6)
57.9
(14.4)
67.0
(19.4)
79.9
(26.6)
88.1
(31.2)
92.2
(33.4)
95.0
(35.0)
93.7
(34.3)
88.9
(31.6)
79.6
(26.4)
70.2
(21.2)
61.2
(16.2)
96.4
(35.8)
Mean daily maximum °F (°C)36.8
(2.7)
39.0
(3.9)
45.5
(7.5)
56.4
(13.6)
66.5
(19.2)
76.2
(24.6)
82.1
(27.8)
80.4
(26.9)
73.1
(22.8)
62.1
(16.7)
51.6
(10.9)
42.2
(5.7)
59.3
(15.2)
Daily mean °F (°C)29.9
(−1.2)
31.8
(−0.1)
38.3
(3.5)
48.6
(9.2)
58.4
(14.7)
68.0
(20.0)
74.1
(23.4)
72.7
(22.6)
65.6
(18.7)
54.8
(12.7)
44.7
(7.1)
35.7
(2.1)
51.9
(11.1)
Mean daily minimum °F (°C)23.1
(−4.9)
24.6
(−4.1)
31.1
(−0.5)
40.8
(4.9)
50.3
(10.2)
59.7
(15.4)
66.0
(18.9)
65.1
(18.4)
58.2
(14.6)
47.5
(8.6)
37.9
(3.3)
29.2
(−1.6)
44.5
(6.9)
Mean minimum °F (°C)4.8
(−15.1)
8.3
(−13.2)
15.6
(−9.1)
31.0
(−0.6)
41.2
(5.1)
49.7
(9.8)
58.6
(14.8)
57.7
(14.3)
46.7
(8.2)
35.1
(1.7)
24.4
(−4.2)
13.1
(−10.5)
2.6
(−16.3)
Record low °F (°C)−13
(−25)
−18
(−28)
−8
(−22)
11
(−12)
31
(−1)
41
(5)
50
(10)
46
(8)
34
(1)
25
(−4)
−2
(−19)
−17
(−27)
−18
(−28)
Average precipitation inches (mm)3.39
(86)
3.21
(82)
4.17
(106)
3.63
(92)
3.25
(83)
3.89
(99)
3.27
(83)
3.23
(82)
3.56
(90)
4.03
(102)
3.66
(93)
4.30
(109)
43.59
(1,107)
Average snowfall inches (cm)14.3
(36)
14.4
(37)
9.0
(23)
1.6
(4.1)
0.0
(0.0)
0.0
(0.0)
0.0
(0.0)
0.0
(0.0)
0.0
(0.0)
0.2
(0.51)
0.7
(1.8)
9.0
(23)
49.2
(125)
Average precipitation days (≥ 0.01 in)11.810.611.611.611.810.99.49.09.010.510.311.9128.4
Average snowy days (≥ 0.1 in)6.66.24.40.80.00.00.00.00.00.20.64.223.0
Average relative humidity (%)62.362.063.163.066.768.568.470.871.868.567.565.466.5
Average dew point °F (°C)16.5
(−8.6)
17.6
(−8.0)
25.2
(−3.8)
33.6
(0.9)
45.0
(7.2)
55.2
(12.9)
61.0
(16.1)
60.4
(15.8)
53.8
(12.1)
42.8
(6.0)
33.4
(0.8)
22.1
(−5.5)
38.9
(3.8)
Mean monthly sunshine hours 163.4168.4213.7227.2267.3286.5300.9277.3237.1206.3143.2142.32,633.6
Percent possible sunshine 56575857596365646360495059
Average ultraviolet index 1245788864215
Source 1: NOAA (relative humidity, dew point and sun 1961−1990) [29] [30] [31]
Source 2: Weather Atlas (UV) [32]
Climate data for Boston, Massachusetts
MonthJanFebMarAprMayJunJulAugSepOctNovDecYear
Average sea temperature °F (°C)41.3
(5.2)
38.1
(3.4)
38.4
(3.5)
43.1
(6.2)
49.2
(9.5)
58.4
(14.7)
65.7
(18.7)
67.9
(20.0)
64.8
(18.2)
59.4
(15.3)
52.3
(11.3)
46.6
(8.2)
52.1
(11.2)
Source: Weather Atlas [32]
MonthJanFebMarAprMayJunJulAugSepOctNovDecYear
Record high °F (°C)70
(21)
72
(22)
90
(32)
98
(37)
96
(36)
98
(37)
102
(39)
104
(40)
100
(38)
88
(31)
81
(27)
77
(25)
104
(40)
Mean maximum °F (°C)58.7
(14.8)
57.9
(14.4)
67.1
(19.5)
79.3
(26.3)
87.2
(30.7)
91.5
(33.1)
94.8
(34.9)
92.7
(33.7)
87.6
(30.9)
78.9
(26.1)
70.1
(21.2)
61.5
(16.4)
96.6
(35.9)
Mean daily maximum °F (°C)38.3
(3.5)
40.5
(4.7)
47.7
(8.7)
58.9
(14.9)
68.9
(20.5)
77.7
(25.4)
83.6
(28.7)
82.2
(27.9)
74.8
(23.8)
63.8
(17.7)
53.2
(11.8)
43.4
(6.3)
61.1
(16.2)
Daily mean °F (°C)30.2
(−1.0)
32.0
(0.0)
38.9
(3.8)
49.3
(9.6)
59.1
(15.1)
68.2
(20.1)
74.4
(23.6)
73.0
(22.8)
65.6
(18.7)
54.4
(12.4)
44.5
(6.9)
35.5
(1.9)
52.1
(11.2)
Mean daily minimum °F (°C)22.1
(−5.5)
23.5
(−4.7)
30.2
(−1.0)
39.6
(4.2)
49.2
(9.6)
58.8
(14.9)
65.2
(18.4)
63.9
(17.7)
56.5
(13.6)
45.1
(7.3)
35.8
(2.1)
27.6
(−2.4)
43.1
(6.2)
Mean minimum °F (°C)4.1
(−15.5)
7.4
(−13.7)
15.1
(−9.4)
28.5
(−1.9)
38.1
(3.4)
47.2
(8.4)
56.2
(13.4)
54.3
(12.4)
43.1
(6.2)
31.7
(−0.2)
21.8
(−5.7)
12.3
(−10.9)
2.0
(−16.7)
Record low °F (°C)−13
(−25)
−17
(−27)
1
(−17)
11
(−12)
29
(−2)
39
(4)
48
(9)
40
(4)
32
(0)
20
(−7)
6
(−14)
−12
(−24)
−17
(−27)
Average precipitation inches (mm)3.96
(101)
3.44
(87)
4.90
(124)
4.29
(109)
3.37
(86)
3.81
(97)
2.91
(74)
3.59
(91)
4.17
(106)
4.18
(106)
4.27
(108)
4.65
(118)
47.54
(1,208)
Average snowfall inches (cm)10.3
(26)
10.5
(27)
6.4
(16)
0.6
(1.5)
0.0
(0.0)
0.0
(0.0)
0.0
(0.0)
0.0
(0.0)
0.0
(0.0)
0.2
(0.51)
1.0
(2.5)
7.6
(19)
36.6
(93)
Average precipitation days (≥ 0.01 in)11.210.311.611.712.210.89.39.19.110.29.611.9127.0
Average snowy days (≥ 0.1 in)5.75.43.70.40.00.00.00.00.00.10.63.419.3
Average relative humidity (%)63.963.062.961.466.670.171.072.573.070.268.967.067.5
Average dew point °F (°C)16.3
(−8.7)
17.4
(−8.1)
25.0
(−3.9)
33.1
(0.6)
45.0
(7.2)
55.6
(13.1)
61.5
(16.4)
61.0
(16.1)
53.8
(12.1)
42.6
(5.9)
33.3
(0.7)
22.1
(−5.5)
38.9
(3.8)
Mean monthly sunshine hours 171.7172.6215.6225.1254.9274.1290.6262.8233.0208.7148.0148.62,605.7
Percent possible sunshine 58585856576063616261505258
Average ultraviolet index 1246788864215
Source 1: NOAA (relative humidity, dew point, and sun 1961–1990) [34] [35] [36]
Source 2: Weather Atlas [37]
Climate data for Providence
MonthJanFebMarAprMayJunJulAugSepOctNovDecYear
Average sea temperature °F (°C)41.4
(5.2)
38.1
(3.4)
38.7
(3.8)
44.1
(6.7)
50.9
(10.5)
59.6
(15.3)
67.0
(19.4)
69.3
(20.7)
66.7
(19.3)
61.6
(16.4)
54.2
(12.3)
47.7
(8.8)
53.3
(11.8)
Source: Weather Atlas [37]

Demographics

St. Patrick's Day Parade in Scituate, Massachusetts, in Plymouth County, the municipality with the highest percentage identifying Irish ancestry in the United States, at 47.5% in 2010. Irish Americans constitute the largest ethnicity in Greater Boston. St. Patrick's Day Parade, Scituate MA.jpg
St. Patrick's Day Parade in Scituate, Massachusetts, in Plymouth County, the municipality with the highest percentage identifying Irish ancestry in the United States, at 47.5% in 2010. Irish Americans constitute the largest ethnicity in Greater Boston.
Boston's Chinatown, with its paifang gate, is home to many Chinese and also Vietnamese restaurants. Boston Chinatown Paifang.jpg
Boston's Chinatown, with its paifang gate, is home to many Chinese and also Vietnamese restaurants.
Boston gay pride march, held annually in June Were a gay and happy family wagon.jpg
Boston gay pride march, held annually in June

Greater Boston has a sizable Jewish community, estimated at between 210,000 people, [39] [40] and 261,000 [41] or 5–6% of the Greater Boston metro population, compared with about 2% for the nation as a whole. Contrary to national trends, the number of Jews in Greater Boston has been growing, fueled by the fact that 60% of children in Jewish mixed-faith families are raised Jewish, compared with roughly one in three nationally. [39]

The City of Boston also has one of the largest LGBT populations per capita. It ranks fifth of all major cities in the country (behind San Francisco, and slightly behind Seattle, Atlanta, and Minneapolis), with 12.3% of the city identifying as gay, lesbian, or bisexual. [42]

County 2021 Estimate2020 CensusChangeAreaDensity
Middlesex County, Massachusetts 1,614,7421,632,002−1.06%817.82 sq mi (2,118.1 km2)
Essex County, Massachusetts 807,074809,829−0.34%492.56 sq mi (1,275.7 km2)
Suffolk County, Massachusetts 771,245797,936−3.35%58.15 sq mi (150.6 km2)
Norfolk County, Massachusetts 724,505725,981−0.20%396.11 sq mi (1,025.9 km2)
Plymouth County, Massachusetts 533,003530,819+0.41%659.07 sq mi (1,707.0 km2)
Rockingham County, New Hampshire 316,947314,176+0.88%694.72 sq mi (1,799.3 km2)
Strafford County, New Hampshire 132,416130,889+1.17%368.97 sq mi (955.6 km2)
Total4,899,9324,941,642−0.84%3,487.40 sq mi (9,032.3 km2)

The 40 most diverse Census tracts in the Boston CSA: [43]

The 40 census tracts in the Boston CSA with the highest percentage of residents who identify as Hispanic or Latino: [43]

Census tracts in the Boston CSA with the highest percentage of residents who identify as Black American: [43]

Census tracts in the Boston CSA with the highest percentage of residents who identify as Asian American: [43]

Census tracts in the Boston CSA with the highest percentage of residents who identify as Irish American: [44]

Census tracts in the Boston CSA with the highest percentage of residents who identify as Italian American: [45]

Census tracts in the Boston CSA with the highest percentage of residents who identify as Portuguese American: [46]

Census tracts in the Boston CSA with French or French Canadian listed as first ancestry: [47]

Largest cities and towns

Cities and towns with a population over 50,000 as of the 2020 census include: [48] [49] [50] [51] [52]

State capital
State largest city
RankNameStatePopulation (2020)Population (2010)Change
1. Boston Flag of Massachusetts.svg  Massachusetts 675,647617,594+9.40%
2. Worcester 206,518181,045+14.07%
3. Providence Flag of Rhode Island.svg  Rhode Island 190,934178,042+7.24%
4. Cambridge Flag of Massachusetts.svg  Massachusetts 118,403105,162+12.59%
5. Manchester Flag of New Hampshire.svg  New Hampshire 115,644109,565+5.55%
6. Lowell Flag of Massachusetts.svg  Massachusetts 115,554106,519+8.48%
7. Brockton 105,64393,810+12.61%
8. Quincy 101,63692,271+10.15%
9. Lynn 101,25390,329+12.09%
10. New Bedford 101,07995,072+6.32%
11. Fall River 94,00088,857+5.79%
12. Nashua Flag of New Hampshire.svg  New Hampshire 91,32286,494+5.58%
13. Lawrence Flag of Massachusetts.svg  Massachusetts 89,14376,377+16.71%
14. Newton 88,92385,146+4.44%
15. Cranston Flag of Rhode Island.svg  Rhode Island 82,93480,387+3.17%
16. Warwick 82,82382,672+0.18%
17. Somerville Flag of Massachusetts.svg  Massachusetts 81,04575,754+6.98%
18. Pawtucket Flag of Rhode Island.svg  Rhode Island 75,60471,148+6.26%
19. Framingham Flag of Massachusetts.svg  Massachusetts 72,36268,318+5.92%
20. Haverhill 67,78760,879+11.35%
21. Malden 66,26359,450+11.46%
22. Waltham 65,21860,632+7.56%
23. Brookline 63,19158,732+7.59%
24. Revere 62,18651,755+20.15%
25. Plymouth 61,21756,468+8.41%
26. Medford 59,65956,173+6.21%
27. Taunton 59,40855,874+6.32%
28. Weymouth 57,43753,743+6.87%
29. Peabody 54,48151,251+6.30%
30. Methuen 53,05947,255+12.28%

Education

Harvard University, a leading global university, is located in Cambridge, MA in Greater Boston Widener Library.jpg
Harvard University, a leading global university, is located in Cambridge, MA in Greater Boston

A long established center of higher education, the area includes many community colleges, two-year schools, and internationally prominent undergraduate and graduate institutions. The graduate schools include highly regarded schools of law, medicine, business, technology, international relations, public health, education, and religion. Greater Boston contains seven R1 Research Institutions as per the Carnegie Classification of Institutions of Higher Education. This is, by far, the highest number of such institutions in a single Metropolitan Statistical Area in the United States.

Economy

Major companies

References: [53] [54] [55] [56]

Transportation

Interstates

U.S. Routes

State Highways

Bridges and tunnels

Airports

Rail and bus

The MBTA district, with Commuter Rail lines in purple MBTA Commuter Rail and funding district map.svg
The MBTA district, with Commuter Rail lines in purple

The first railway line in the United States was in Quincy. See Neponset River.

The following Regional Transit Authorities have bus service that connects with MBTA commuter rail stations:

Ocean transportation

The Salem Ferry, 92 ft. Catamaran is photographed approaching its dock off Blaney Street at the Salem Maritime National Historic Site in Salem, Massachusetts, United States. Salem Ferry.JPG
The Salem Ferry, 92 ft. Catamaran is photographed approaching its dock off Blaney Street at the Salem Maritime National Historic Site in Salem, Massachusetts, United States.

Sports

ClubSportLeagueStadiumEstablishedLeague titles
Boston Bruins Ice hockey National Hockey League TD Garden (Boston)19246 Stanley Cups
7 Eastern Conference Titles
Boston Celtics Basketball National Basketball Association TD Garden (Boston)194617 NBA Championships
21 Eastern Conference Titles
Boston Red Sox Baseball Major League Baseball Fenway Park (Boston)19019 MLB World Series Championships
14 American League Pennants
New England Patriots Football National Football League Gillette Stadium (Foxboro)19606 Super Bowl Championships
11 AFC Championships
New England Revolution Soccer Major League Soccer Gillette Stadium (Foxboro)19961 US Open Cup
1 SuperLiga

Annual sporting events include:

The Greater Boston League, a high school athletic conference in Massachusetts.

Notes

  1. Mean monthly maxima and minima (i.e. the expected highest and lowest temperature readings at any point during the year or given month) calculated based on data at said location from 1991 to 2020.
  2. Official records for Concord were kept at downtown from September 1868 to April 1941 and at Concord Municipal Airport since May 1941; snow records date from December 1942. For more information, see ThreadEx
  3. Mean monthly maxima and minima (i.e. the expected highest and lowest temperature readings at any point during the year or given month) calculated based on data at said location from 1991 to 2020.
  4. Official records for Boston were kept at downtown from January 1872 to December 1935, and at Logan Airport (KBOS) since January 1936. [28]
  5. Mean monthly maxima and minima (i.e. the expected highest and lowest temperature readings at any point during the year or given month) calculated based on data at said location from 1991 to 2020.
  6. Official records for Providence kept at downtown from November 1904 to May 1932 and at T. F. Green Airport since June 1932. [33]

Related Research Articles

<span class="mw-page-title-main">New Hampshire</span> U.S. state

New Hampshire is a state in the New England region of the Northeastern United States. It borders Massachusetts to the south, Vermont to the west, Maine and the Gulf of Maine to the east, and the Canadian province of Quebec to the north. Of the 50 U.S. states, New Hampshire is the fifth smallest by area and the tenth least populous, with a population of 1,377,529 residents as of the 2020 census. Concord is the state capital and Manchester is the most populous city. New Hampshire's motto, "Live Free or Die", reflects its role in the American Revolutionary War; its nickname, "The Granite State", refers to its extensive granite formations and quarries. It is well known nationwide for holding the first primary in the U.S. presidential election cycle, and for its resulting influence on American electoral politics.

<span class="mw-page-title-main">Bristol County, Massachusetts</span> County in Massachusetts, United States

Bristol County is a county in the Commonwealth of Massachusetts. As of the 2020 census, the population was 579,200. The shire town is Taunton. Some governmental functions are performed by the Commonwealth of Massachusetts, others by the county, and others by local towns and cities.

<span class="mw-page-title-main">Windham County, Connecticut</span> County in Connecticut, United States

Windham County is one of the eight historical counties in the U.S. state of Connecticut, located in its northeastern corner. As of the 2020 census, the population was 116,418, making it the least populous county in Connecticut. It forms the core of the region known as the Quiet Corner. Windham County is included in the Worcester, MA-CT Metropolitan Statistical Area, which is also included in the Boston-Worcester-Providence, MA-RI-NH-CT Combined Statistical Area. The entire county is within the Quinebaug and Shetucket Rivers Valley National Heritage Corridor, as designated by the National Park Service.

<span class="mw-page-title-main">Providence County, Rhode Island</span> County in Rhode Island, United States

Providence County is the most populous county in the U.S. state of Rhode Island. As of the 2020 census, the county's population was 660,741, or 60.2% of the state's population. Providence County contains the city of Providence, the state capital of Rhode Island and the county's most populous city, with an estimated 190,934 residents in 2020. Providence County is included in the Providence-Warwick, RI-MA Metropolitan Statistical Area, which in turn constitutes a portion of the greater Boston-Worcester-Providence, MA-RI-NH-CT Combined Statistical Area. As of 2010, the center of population in Rhode Island is located in Providence County, in the city of Cranston.

<span class="mw-page-title-main">Seekonk, Massachusetts</span> Town in Massachusetts, United States

Seekonk is a town in Bristol County, Massachusetts, United States, on the Massachusetts border with Rhode Island. It was incorporated in 1812 from the western half of Rehoboth. The population was 15,531 at the 2020 census. In 1862, under a U.S. Supreme Court decision resolving a longstanding border dispute between Massachusetts and Rhode Island, a portion of Tiverton, Rhode Island was awarded to Massachusetts to become part of Fall River, while two-thirds of Seekonk was awarded to Rhode Island.

<span class="mw-page-title-main">Errol, New Hampshire</span> Town in New Hampshire, United States

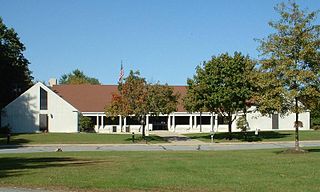
Errol is a town in Coös County, New Hampshire, United States. The population was 298 at the 2020 census. It is located north of the White Mountains along Route 16 at its intersection of Route 26. It has a municipal airport with a single, unpaved runway.

<span class="mw-page-title-main">Nashua, New Hampshire</span> City in New Hampshire, United States

Nashua is a city in southern New Hampshire, United States. As of the 2020 census, it had a population of 91,322, the second-largest in northern New England after nearby Manchester. Along with Manchester, it is a seat of New Hampshire's most populous county, Hillsborough.

<span class="mw-page-title-main">Warwick, Rhode Island</span> City in Rhode Island, United States

Warwick is a city in Kent County, Rhode Island, United States, and is the third largest city in the state with a population of 82,823 at the 2020 census. Warwick is located approximately 12 miles (19 km) south of downtown Providence, Rhode Island, 63 miles (101 km) southwest of Boston, Massachusetts, and 171 miles (275 km) northeast of New York City.

<span class="mw-page-title-main">Greenville, New Hampshire</span> Town in New Hampshire, United States

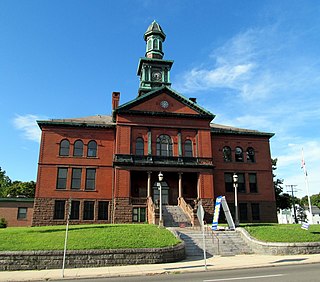
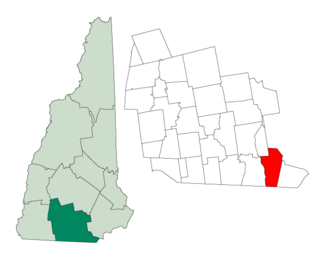
Greenville is a town in Hillsborough County, New Hampshire, United States. The population was 1,974 at the 2020 census, down from 2,105 at the 2010 census. It is located at the junctions of New Hampshire routes 31, 45, and 123.

<span class="mw-page-title-main">Hudson, New Hampshire</span> Town in New Hampshire, United States

Hudson is a town in Hillsborough County, New Hampshire, United States. It is located along the Massachusetts state line. The population was 25,394 at the 2020 census. It is the tenth-largest municipality in the state, by population.

<span class="mw-page-title-main">Delaware Valley</span> Combined Statistical Area in the United States

The Delaware Valley, sometimes referred to as Greater Philadelphia or the Philadelphia metropolitan area, is a metropolitan region in the Northeast United States that centers around Philadelphia, the nation's sixth-most populous city, and spans parts of four U.S. states: southeastern Pennsylvania, southern New Jersey, northern Delaware, and the northern Eastern Shore of Maryland. With a core metropolitan statistical area population of 6.288 million residents and a combined statistical area population of 7.366 million as of the 2020 census, the Delaware Valley is the eighth-largest metropolitan region in the nation and North America, and the 68th-largest metropolitan region in the world.

<span class="mw-page-title-main">Northeastern United States</span> One of the four census regions of the United States

The Northeastern United States, also referred to as the Northeast, the East Coast, or the American Northeast, is a geographic region of the United States located on the Atlantic coast of North America. It borders Canada to its north, the Southern United States to its south, the Midwestern United States to its west, and the Atlantic Ocean to its east.

<span class="mw-page-title-main">South Coast (Massachusetts)</span> Region of southeastern Massachusetts

The South Coast of Massachusetts is the region of southeastern Massachusetts consisting of the southern Bristol and Plymouth counties, bordering Buzzards Bay, and includes the cities of Fall River, New Bedford, the southeastern tip of East Taunton and nearby towns. The Rhode Island towns of Tiverton and Little Compton, located in Newport County, are often included within the South Coast designation due to regional similarities with adjacent communities.

<span class="mw-page-title-main">Greater Bridgeport</span> Metropolitan statistical area in Connecticut, United States

Stamford-Bridgeport-Norwalk is a metropolitan area in the U.S. state of Connecticut. The area is located in Southwestern Connecticut. In its most conservative form the area consists of the city of Bridgeport and five surrounding towns—Easton, Fairfield, Monroe, Stratford, and Trumbull. This definition of the Stamford area has a population of more than 305,000 and is within the Stamford -Bridgeport-Norwalk-Danbury metropolitan statistical area, which consists of all of Fairfield County, Connecticut. The estimated 2015 county population was 948,053. The area is numbered as part of the New York-Newark Combined Statistical Area NY-NJ-CT-PA by the United States Census Bureau.

<span class="mw-page-title-main">Rhode Island statistical areas</span> Rhode Island statistical areas

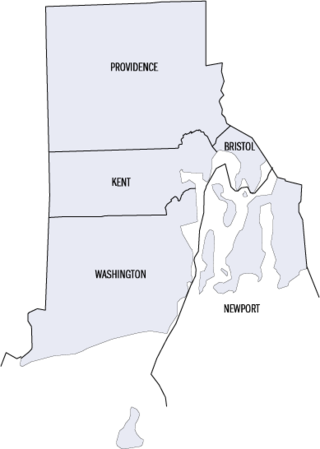
The U.S. State of Rhode Island currently has two statistical areas that have been delineated by the Office of Management and Budget (OMB). On July 21, 2023, the OMB delineated the Providence-Warwick, RI-MA Metropolitan Statistical Area and the Boston-Worcester-Providence, MA-RI-NH Combined Statistical Area. All five counties of Rhode Island are a part of both the Providence-Warwick, RI-MA Metropolitan Statistical Area and the more extensive Boston-Worcester-Providence, MA-RI-NH Combined Statistical Area.

<span class="mw-page-title-main">Providence metropolitan area</span> Metropolitan Statistical Area in the United States

The Providence metropolitan area is a region extending into eight counties in two states. Its core is in the states of Rhode Island and Massachusetts, and it is the 38th largest metropolitan area in the United States. The largest city in the Providence MSA is Providence, Rhode Island, with an estimated population of 1,622,520, exceeding that of Rhode Island by slightly over 60%. The MSA covers all of Rhode Island and Bristol County, Massachusetts, with an average population density of 2300 per mi2.

<span class="mw-page-title-main">Portland metropolitan area, Maine</span> Metropolitan area in United States of America

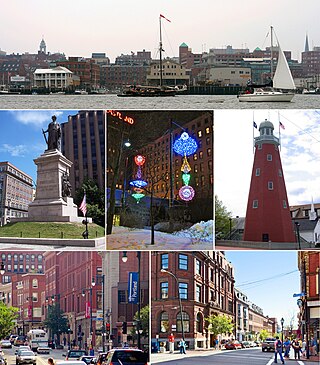
The city of Portland, Maine, is the hub city of a metropolitan area in southern Maine. The region is commonly known as Greater Portland or the Portland metropolitan area. For statistical purposes, the U.S. federal government defines three different representations of the Portland metropolitan area. The Portland–South Portland, Maine, metropolitan statistical area is a region consisting of three counties in Maine, anchored by the city of Portland and the smaller city of South Portland. As of the 2020 census, the MSA had a population of 551,740. A larger combined statistical area (CSA), the Portland–Lewiston–South Portland combined statistical area, is defined as the combination of this metropolitan statistical area (MSA) with the adjacent Lewiston–Auburn MSA. The CSA comprises four counties in southern Maine. The Portland–South Portland metropolitan New England city and town area is defined on the basis of cities and towns rather than entire counties. It consists of most of Cumberland and York counties plus the town of Durham in Androscoggin County. The Greater Portland area has emerged as an important center for the creative economy, which is also bringing gentrification.

<span class="mw-page-title-main">Providence, Rhode Island</span> Capital city of Rhode Island, United States

Providence is the capital and most populous city of the U.S. state of Rhode Island. The county seat of Providence County, it is one of the oldest cities in New England, founded in 1636 by Roger Williams, a Reformed Baptist theologian and religious exile from the Massachusetts Bay Colony. He named the area in honor of "God's merciful Providence" which he believed was responsible for revealing such a haven for him and his followers. The city developed as a busy port, as it is situated at the mouth of the Providence River at the head of Narragansett Bay.

<span class="mw-page-title-main">Climate of New England</span> Overview of the climate of New England

The climate of New England varies greatly across its 500-mile (800 km) span from northern Maine to southern Connecticut.

<span class="mw-page-title-main">Cincinnati metropolitan area</span> Metropolitan Statistical Area in the United States

The Cincinnati metropolitan area is a metropolitan area with its core in Ohio and Kentucky. Its largest city is Cincinnati and includes surrounding counties in the U.S. states of Ohio, Kentucky, and Indiana.

References

  1. "Total Real Gross Domestic Product for Boston-Cambridge-Newton, MA-NH (MSA)". Federal Reserve Economic Data . Federal Reserve Bank of St. Louis.
  2. 1 2 "Why Boston Will Be the Star of The AI Revolution". VentureFizz. October 24, 2017. Retrieved November 9, 2023. Boston startups are working to overcome some of the largest technical barriers holding AI back, and they're attracting attention across a wide variety of industries in the process.
  3. "Housing and Economic Development:Key Industries". mass.gov. Archived from the original on April 22, 2015. Retrieved May 9, 2016.
  4. Will Joyner (April 9, 1999). "Where Literary Legends Took Shape Around Boston". The New York Times . Retrieved May 9, 2016.
  5. "The 1692 Salem Witch Trials". SalemWitchTrialsMuseum.com. Retrieved May 9, 2016.
  6. "Faneuil Hall". Celebrateboston.com. Retrieved April 21, 2015.
  7. "The Temperance Issue in the Election of 1840: Massachusetts". Teachushistory.org. Retrieved May 9, 2016.
  8. Packer, Barbara (2007). The Transcendentalists. University of Georgia Press; First edition (April 25, 2007). ISBN   978-0820329581.
  9. "Images of the Antislavery Movement in Massachusetts". Massachusetts Historical Society. Retrieved May 9, 2016.
  10. "Massachusetts court strikes down ban on same-sex marriage". CNN. Reuters. November 18, 2003. Retrieved April 21, 2015.
  11. "History of Harvard University". Harvard University . Archived from the original on May 2, 2015. Retrieved April 21, 2015.
  12. Tamar Lewin (January 28, 2015). "Harvard's Endowment Remains Biggest of All". The New York Times . Retrieved May 9, 2016.
  13. Richard Wolf (March 16, 2016). "Meet Merrick Garland, Obama's Supreme Court nominee". USA Today . Retrieved May 9, 2016.
  14. "Kendall Square Initiative". MIT. Retrieved December 1, 2016.
  15. Lelund Cheung. "When a neighborhood is crowned the most innovative square mile in the world, how do you keep it that way?". Boston Globe Media Partners, LLC. Retrieved December 1, 2016.
  16. "World Reputation Rankings". www.timeshighereducation.com. April 21, 2016. Retrieved May 9, 2016.
  17. 1 2 "About MAPC". Metropolitan Area Planning Council. Archived from the original on February 21, 2007. Retrieved May 14, 2007.
  18. "Metropolitan Area Planning Council Strategic Plan 2015–2020" (PDF). Metropolitan Area Planning Council. Archived from the original (PDF) on October 11, 2016. Retrieved April 22, 2017.
  19. "Transportation Plan – Overview". Boston Region Metropolitan Planning Organization. 2009. Archived from the original on August 29, 2008. Retrieved September 27, 2009.
  20. "Metro Area - the Region". Archived from the original on February 21, 2007.
  21. 1 2 "Boston-Cambridge-Newton, MA-NH Metro Area". data.census.gov. Retrieved April 8, 2024.
  22. "Boston-Cambridge-Newton, MA-NH Metropolitan NECTA". censusreporter.org. Archived from the original on July 30, 2023. Retrieved April 8, 2024.
  23. "Boston-Worcester-Providence, MA-RI-NH-CT Combined Statistical Area" (PDF). census.gov. Retrieved April 8, 2024.
  24. "NowData – NOAA Online Weather Data". National Oceanic and Atmospheric Administration. Retrieved May 18, 2021.
  25. "Station: CONCORD MUNI AP, NH". U.S. Climate Normals 2020: U.S. Monthly Climate Normals (1991–2020). National Oceanic and Atmospheric Administration. Archived from the original on July 10, 2023. Retrieved May 18, 2021.
  26. "WMO Climate Normals for CONCORD MUNICIPAL AP, NH 1961–1990". National Oceanic and Atmospheric Administration. Archived from the original on July 10, 2023. Retrieved March 11, 2014.
  27. "Concord, New Hampshire, USA - Monthly weather forecast and Climate data". Weather Atlas. Retrieved July 4, 2019.
  28. ThreadEx
  29. "Summary of Monthly Normals 1991–2020". National Oceanic and Atmospheric Administration. Retrieved May 4, 2021.
  30. "NowData – NOAA Online Weather Data". National Oceanic and Atmospheric Administration . Retrieved May 24, 2021.
  31. "WMO Climate Normals for BOSTON/LOGAN INT'L AIRPORT, MA 1961–1990". National Oceanic and Atmospheric Administration. Retrieved July 18, 2020.
  32. 1 2 "Boston, Massachusetts, USA - Monthly weather forecast and Climate data". Weather Atlas. Retrieved July 4, 2019.
  33. ThreadEx
  34. "NowData – NOAA Online Weather Data". National Oceanic and Atmospheric Administration . Retrieved May 30, 2021.
  35. "Station: Providence T F Green AP, RI". U.S. Climate Normals 2020: U.S. Monthly Climate Normals (1991–2020). National Oceanic and Atmospheric Administration. Archived from the original on June 24, 2023. Retrieved May 30, 2021.
  36. "WMO Climate Normals for PROVIDENCE/GREEN STATE, RI 1961–1990". National Oceanic and Atmospheric Administration. Archived from the original on June 24, 2023. Retrieved September 17, 2020.
  37. 1 2 "Providence, Rhode Island, USA - Monthly weather forecast and Climate data". Weather Atlas. Retrieved July 4, 2019.
  38. Jane Walsh (November 25, 2015). "The most Irish town in America is named using US census data". Irish Central. Retrieved May 8, 2016.
  39. 1 2 Michael Paulson (November 10, 2006). "Jewish population in region rises". The Boston Globe. Retrieved November 29, 2009.
  40. "Cities with the Largest Jewish Population in the Diaspora". adherents.com. Archived from the original on December 6, 1999. Retrieved November 29, 2009.{{cite web}}: CS1 maint: unfit URL (link)
  41. "Metro Area Membership Report". The Association of Religion Data Archives. Retrieved November 29, 2009.
  42. "12.9% in Seattle are gay or bisexual, second only to S.F., study says". The Seattle Times. The Seattle Times Company. 2006. Retrieved May 1, 2009.
  43. 1 2 3 4 "Mapping the 2010 U.S. Census". The New York Times. December 13, 2010.
  44. "Irish as First Ancestry Population Percentage Rank of Census Tract within 100 miles of Zip Code 02176". Usa.com. Retrieved January 4, 2015.
  45. "Italian as First Ancestry Population Percentage Rank of Census Tract within 100 miles of Zip Code 02176". Usa.com. Retrieved January 4, 2015.
  46. "Welcome to nginx". www.usa.com. Archived from the original on October 1, 2014. Retrieved February 2, 2022.
  47. "French as First Ancestry Population Percentage Rank of Census Tract within 100 miles of Zip Code 02176". Usa.com. Retrieved January 4, 2015.
  48. "Explore Census Data". U.S. Census Bureau. Retrieved February 3, 2022.
  49. "Profile of General Population and Housing Characteristics: 2010 Census Summary File 1 (DP-1): Connecticut". American Factfinder. U.S. Census Bureau. Archived from the original on February 13, 2020. Retrieved December 18, 2018.
  50. "Profile of General Population and Housing Characteristics: 2010 Census Summary File 1 (DP-1): Massachusetts". American Factfinder. U.S. Census Bureau. Archived from the original on February 13, 2020. Retrieved December 18, 2018.
  51. "Profile of General Population and Housing Characteristics: 2010 Census Summary File 1 (DP-1): New Hampshire". American Factfinder. U.S. Census Bureau. Archived from the original on February 13, 2020. Retrieved December 18, 2018.
  52. "Profile of General Population and Housing Characteristics: 2010 Census Summary File 1 (DP-1): Rhode Island". American Factfinder. U.S. Census Bureau. Archived from the original on February 13, 2020. Retrieved December 18, 2018.
  53. "2009 Globe 100 – Top Massachusetts-based employers". The Boston Globe. January 19, 2010. Archived from the original on May 22, 2009.
  54. Archived March 10, 2009, at the Wayback Machine
  55. "Top Companies in Massachusetts on the Inc. 5000 - Inc.com". Inc.com. Retrieved January 4, 2015.
  56. Archived October 10, 2007, at the Wayback Machine
  57. "Who We Are & About Us - Vistaprint". News.vistaprint.com. Archived from the original on October 18, 2014. Retrieved January 4, 2015.
  58. Goodison, Donna (July 20, 2016). "Wolverine strides into Waltham". Boston Herald. Retrieved May 17, 2022.

Further reading