Bamberg County, South Carolina

Last updated

Bamberg County
Voorhees College Historic District.jpg
St. Philip's Episcopal Church
Bamberg County Seal.jpg
Bamberg County Logo.png
Motto: 
"Bamberg County Naturally"
Map of South Carolina highlighting Bamberg County.svg
Location within the U.S. state of South Carolina
South Carolina in United States.svg
South Carolina's location within the U.S.
Coordinates: 33°12′N81°03′W / 33.20°N 81.05°W / 33.20; -81.05
CountryFlag of the United States.svg United States
StateFlag of South Carolina.svg  South Carolina
Founded1897
Named for Francis Marion Bamberg [1]
Seat Bamberg
Largest communityBamberg
Area
  Total395.57 sq mi (1,024.5 km2)
  Land393.37 sq mi (1,018.8 km2)
  Water2.20 sq mi (5.7 km2)  0.56%
Population
 (2020)
  Total13,311
  Estimate 
(2023)
12,974
  Density33.84/sq mi (13.07/km2)
Time zone UTC−5 (Eastern)
  Summer (DST) UTC−4 (EDT)
Congressional district 6th
Website www.bambergcountysc.gov

Bamberg County is a county located in the southwestern portion of U.S. state of South Carolina. As of the 2020 census, the population was 13,311, [2] making the rural county the fourth-least populous of any in South Carolina. Its county seat is Bamberg. [3]

Contents

Voorhees University (formerly Voorhees College), a historically black university, was established here in the late nineteenth century. It is affiliated with the Episcopal Church.

History

Part of an agricultural area since the antebellum years, this upland area was developed for the cultivation of short-staple cotton. As a result, African Americans have comprised a large portion of the workers and population for much of the county's history.

The rural county was created from the eastern portion of Barnwell County, under the new South Carolina Constitution adopted in 1895; it included an article prescribing the process to establish new counties. [4] The referendum on creating Bamberg County was held on January 19, 1897. The name Bamberg was selected to honor General Francis Marion Bamberg. [5] In 1919 and again in 1920, tiny portions of northwestern Colleton County were annexed to Bamberg County.

Geography

Bamberg County, South Carolina
Interactive map of Bamberg County

According to the U.S. Census Bureau, the county has a total area of 395.57 square miles (1,024.5 km2), of which 393.37 square miles (1,018.8 km2) is land and 2.20 square miles (5.7 km2) (0.56%) is water. [6] It is the fourth-smallest county in South Carolina by land area and third-smallest by total area.

State and local protected areas

Major water bodies

Adjacent counties

Major highways

Major infrastructure

Demographics

Historical population
CensusPop.Note
1900 17,296
1910 18,5447.2%
1920 20,96213.0%
1930 19,410−7.4%
1940 18,643−4.0%
1950 17,533−6.0%
1960 16,274−7.2%
1970 15,950−2.0%
1980 18,11813.6%
1990 16,902−6.7%
2000 16,658−1.4%
2010 15,987−4.0%
2020 13,311−16.7%
2023 (est.)12,974 [2] −2.5%
U.S. Decennial Census [8]
1790–1960 [9] 1900–1990 [10]
1990–2000 [11] 2010 [12] 2020 [2]

2020 census

Bamberg County racial composition [13]
RaceNum.Perc.
White (non-Hispanic)5,01037.64%
Black or African American (non-Hispanic)7,74958.22%
Native American 250.19%
Asian 660.5%
Other/Mixed 3202.4%
Hispanic or Latino 1411.06%

As of the 2020 census, there were 13,311 people, 5,334 households, and 3,355 families residing in the county.

2010 census

At the 2010 census, there were 15,987 people, 6,048 households, and 3,920 families living in the county. [14] [12] The population density was 40.6 inhabitants per square mile (15.7/km2). There were 7,716 housing units at an average density of 19.6 per square mile (7.6/km2). [15] The racial makeup of the county was 61.5% black or African American, 36.1% white, 0.4% Asian, 0.3% American Indian, 0.7% from other races, and 1.0% from two or more races. Those of Hispanic or Latino origin made up 1.6% of the population. [14] In terms of ancestry, 5.1% were American, and 5.0% were German. [16]

Of the 6,048 households, 31.4% had children under the age of 18 living with them, 38.3% were married couples living together, 21.6% had a female householder with no husband present, 35.2% were non-families, and 31.8% of all households were made up of individuals. The average household size was 2.44 and the average family size was 3.07. The median age was 39.3 years. [14]

The median income for a household in the county was $32,538 and the median income for a family was $41,625. Males had a median income of $33,893 versus $27,324 for females. The per capita income for the county was $16,236. About 23.6% of families and 29.9% of the population were below the poverty line, including 40.7% of those under age 18 and 27.0% of those age 65 or over. [17]

2000 census

At the 2000 census, [18] there were 16,658 people, 6,123 households, and 4,255 families living in the county. The population density was 42 people per square mile (16 people/km2). There were 7,130 housing units at an average density of 18 per square mile (6.9/km2). The racial makeup of the county was 62.50% Black or African American, 36.47% White, 0.16% Native American, 0.19% Asian, 0.01% Pacific Islander, 0.14% from other races, and 0.53% from two or more races. 0.71% of the population were Hispanic or Latino of any race.

There were 6,123 households, out of which 31.10% had children under the age of 18 living with them, 43.60% were married couples living together, 21.30% had a female householder with no husband present, and 30.50% were non-families. 27.80% of all households were made up of individuals, and 11.60% had someone living alone who was 65 years of age or older. The average household size was 2.55 and the average family size was 3.10.

In the county, the population was spread out, with 25.40% under the age of 18, 12.90% from 18 to 24, 24.60% from 25 to 44, 23.20% from 45 to 64, and 13.90% who were 65 years of age or older. The median age was 35 years. For every 100 females there were 88.70 males. For every 100 females age 18 and over, there were 84.00 males.

The median income for a household in the county was $24,007, and the median income for a family was $29,360. Males had a median income of $25,524 versus $3 for females. The per capita income for the county was $12,584. About 23.90% of families and 27.80% of the population were below the poverty line, including 87.00% of those under age 18 and 80% of those age 65 or over. [19]

Law and Government

The Bamberg county council is the governing body in the county. The council consists of seven members, elected from single-member districts:Sharon Hammond-District 2, Larry Haynes-District 3, Joe Guess, Jr- District 4, Isaiah Odom-District 5, Evert Comer, Jr- District 6, Clint Carter-District 7.

Politics

Prior to 1948, Bamberg County and South Carolina were Democratic Party strongholds similar to the rest of the Solid South, dominated by white Democrats. Most of the majority population of African Americans, who had supported the Republican Party during Reconstruction and the nineteenth century, had been disenfranchised by Democrats under the 1895 state constitution and related laws. These raised barriers to black voter registration and voting in South Carolina, as did similar laws across the South. After excluding blacks from the political system, the white-dominated legislature passed Jim Crow laws imposing legal segregation. Most blacks did not recover the ability to vote until years after passage of federal civil rights legislation in the mid-1960s.

As a result of the exclusion of black Republicans, white Democratic voters controlled elections in this state and others of the former Confederacy for decades, creating the Solid South. They elected Democratic presidential candidates by nearly unanimous margins of victory, while preserving all the power associated with apportionment based on total population.

The twenty years from 1948 to 1968 were transitional years for the politics of South Carolina and Bamberg County. President Harry Truman ordered integration of the military and took other initiatives on civil rights issues. Discontented with that direction, Southern Dixiecrat candidates twice carried the county, and Republican candidates carried the county three times in this timespan, twice before many African Americans began to vote.

Following Congressional passage of the Voting Rights Act of 1965, as a consequence of the civil rights movement, most African Americans in Bamberg County supported the Democratic Party, but they did not get to full voting strength in the county until after the 1972 presidential election, in which conservative whites carried the county for incumbent Republican President Richard Nixon. He had gained considerable support among whites in the South, a sign of what has become a nearly total shifting of their alliance to the Republican Party. In elections since 1972, the majority of county voters, with the enfranchisement of African Americans, have backed a Republican presidential candidate only once, voting for the popular incumbent Ronald Reagan by 16 votes.

United States presidential election results for Bamberg County, South Carolina [20]
Year Republican Democratic Third party
No.%No.%No.%
2020 2,41737.29%4,01061.86%550.85%
2016 2,20435.47%3,89862.73%1121.80%
2012 2,19431.88%4,62467.19%640.93%
2008 2,30933.89%4,42664.95%791.16%
2004 2,13835.42%3,84163.63%570.94%
2000 2,04736.88%3,45162.17%530.95%
1996 1,71532.29%3,38063.63%2174.09%
1992 1,90633.28%3,42659.82%3956.90%
1988 2,40345.73%2,83053.85%220.42%
1984 2,90849.87%2,89249.60%310.53%
1980 2,09838.69%3,29460.75%300.55%
1976 1,84935.45%3,33063.84%370.71%
1972 2,53759.65%1,68039.50%360.85%
1968 1,32727.70%1,84538.52%1,61833.78%
1964 2,36662.51%1,41937.49%00.00%
1960 1,65264.53%90835.47%00.00%
1956 32617.40%43022.95%1,11859.66%
1952 1,40765.23%75034.77%00.00%
1948 341.82%1246.62%1,71591.56%
1944 10610.18%73770.80%19819.02%
1940 131.42%90498.58%00.00%
1936 50.32%1,54299.68%00.00%
1932 150.93%1,59899.07%00.00%
1928 40.51%77999.49%00.00%
1924 70.96%70897.12%141.92%
1920 00.00%688100.00%00.00%
1916 00.00%82099.88%10.12%
1912 30.48%61699.35%10.16%
1904 232.58%86897.42%00.00%
1900 364.34%79395.66%00.00%

Economy

In 2022, the GDP of Bamberg County was $380.2 million (about $28,565 per capita). [21] In chained 2017 dollars, the real GDP was $305.5 million (about $22,954 per capita). [22] From 2022 through 2024, the unemployment rate has fluctuated between 4-7%. [23]

As of April 2024, some of the largest employers in the county include Denmark Technical College and Voorhees University. [24]

Employment and Wage Statistics by Industry in Bamberg County, South Carolina [24]
IndustryEmployment CountsEmployment Percentage (%)Average Annual Wage ($)
Accommodation and Food Services2226.417,836
Agriculture, Forestry, Fishing and Hunting1724.938,584
Construction541.533,696
Educational Services68319.644,356
Finance and Insurance1534.447,840
Health Care and Social Assistance47213.540,664
Information110.3137,540
Manufacturing50214.450,232
Other Services (except Public Administration)521.523,400
Professional, Scientific, and Technical Services1143.359,852
Public Administration2717.842,328
Real Estate and Rental and Leasing30.132,032
Retail Trade43212.426,676
Transportation and Warehousing531.550,856
Utilities1253.684,968
Wholesale Trade1654.740,456
Total3,484100.0%42,215

Communities

Cities

Towns

See also

Related Research Articles

<span class="mw-page-title-main">Williamsburg County, South Carolina</span> County in South Carolina, United States

Williamsburg County is a county located in the U.S. state of South Carolina. As of the 2020 census its population was 31,026. The county seat and largest community is Kingstree. After a previous incarnation of Williamsburg County, the current county was created in 1804.

<span class="mw-page-title-main">Saluda County, South Carolina</span> County in South Carolina, United States

Saluda County is a county in the U.S. state of South Carolina. As of the 2020 census, the population was 18,862. Its county seat is Saluda. The county was formed from northern and eastern portions of Edgefield County.

<span class="mw-page-title-main">Orangeburg County, South Carolina</span> County in South Carolina, United States

Orangeburg County is a county located in the U.S. state of South Carolina. As of the 2020 census, the population was 84,223. Its county seat is Orangeburg. The county was created in 1769.

<span class="mw-page-title-main">Newberry County, South Carolina</span> County in South Carolina, United States

Newberry County is a county located in the U.S. state of South Carolina. As of the 2020 census, its population was 37,719. Its county seat is Newberry. The name is of unknown origin, although one theory suggests that it was named by Quaker settlers in honor of their home of Newberry, a suburb of London in the United Kingdom.

<span class="mw-page-title-main">McCormick County, South Carolina</span> County in South Carolina, United States

McCormick County is a county located in the U.S. state of South Carolina. As of the 2020 census, its population was 9,526, making it the second-least populous county in South Carolina. Its county seat is McCormick. The county was formed in 1916 from parts of Edgefield, Abbeville, and Greenwood counties.

<span class="mw-page-title-main">Marlboro County, South Carolina</span> County in South Carolina, United States

Marlboro County is a county located in the Pee Dee region on the northern border of the U.S. state of South Carolina. As of the 2020 census, its population was 26,667. Its county seat is Bennettsville. The Great Pee Dee River runs through it.

<span class="mw-page-title-main">Marion County, South Carolina</span> County in South Carolina, United States

Marion County is a county located in the coastal plain of the U.S. state of South Carolina. As of the 2020 census, its population was 29,183. Its county seat is Marion. It is a majority-minority county.

<span class="mw-page-title-main">Lexington County, South Carolina</span> County in South Carolina, United States

Lexington County is a county located in the U.S. state of South Carolina. As of the 2020 census, the population was 293,991. Its county seat and largest community is Lexington. The county was chartered in 1785 and was named in commemoration of Lexington, Massachusetts, the site of the Battle of Lexington in the American Revolutionary War. Lexington County is the sixth-most populous county in South Carolina by population and is part of the Columbia, SC Metropolitan Statistical Area. It is located in the Midlands region of South Carolina.

<span class="mw-page-title-main">Hampton County, South Carolina</span> County in South Carolina, United States

Hampton County is a rural county located in the U.S. state of South Carolina. As of the 2020 census, the population was 18,561. Its county seat is Hampton. It was named for Confederate Civil War general Wade Hampton, who in the late 1870s, with the ending of Reconstruction, was elected as governor of South Carolina.

<span class="mw-page-title-main">Florence County, South Carolina</span> County in South Carolina, United States

Florence County is a county located in the U.S. state of South Carolina. As of the 2020 census, its population was 137,059. Its county seat is Florence.

<span class="mw-page-title-main">Edgefield County, South Carolina</span> County in South Carolina, United States

Edgefield County is a county located on the western border of the U.S. state of South Carolina. As of the 2020 census, its population was 25,657. Its county seat and largest community is Edgefield. The county was established on March 12, 1785.

<span class="mw-page-title-main">Dorchester County, South Carolina</span> County in South Carolina, United States

Dorchester County is a county located in the U.S. state of South Carolina. As of the 2020 census, the population was 161,540. Its county seat is St. George.

<span class="mw-page-title-main">Colleton County, South Carolina</span> County in South Carolina, United States

Colleton County is in the Lowcountry region of the U.S. state of South Carolina. As of the 2020 census, the population was 38,604. Its county seat is Walterboro. The county is named after Sir John Colleton, 1st Baronet, one of the eight Lords Proprietor of the Province of Carolina. After two previous incarnations, the current Colleton County was created in 1800.

<span class="mw-page-title-main">Chester County, South Carolina</span> County in South Carolina, United States

Chester County is a county located in the U.S. state of South Carolina. As of the 2020 census, its population was 32,294. Its county seat is Chester.

<span class="mw-page-title-main">Barnwell County, South Carolina</span> County in South Carolina, United States

Barnwell County is a county in the U.S. state of South Carolina. As of the 2020 census, its population was 20,589. It is located in the Central Savannah River Area. Its county seat is Barnwell.

<span class="mw-page-title-main">Allendale County, South Carolina</span> County in South Carolina, United States

Allendale County is a county located in the U.S. state of South Carolina. As of the 2020 census, the population was 8,039, making it the least populous county in South Carolina. Its county seat is Allendale.

<span class="mw-page-title-main">Aiken County, South Carolina</span> County in South Carolina, United States

Aiken County is a county in the U.S. state of South Carolina. As of the 2020 census, its population was 168,808. Its county seat and largest community is Aiken. Aiken County is a part of the Augusta-Richmond County, GA-SC Metropolitan Statistical Area. It is mostly in the Sandhills region, with the northern parts reaching in the Piedmont and southern parts reaching into the Coastal Plain.

<span class="mw-page-title-main">Bamberg, South Carolina</span> City in South Carolina, United States

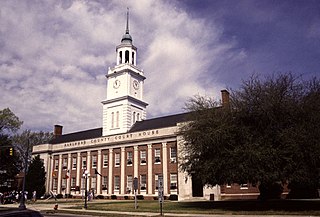
Bamberg is a city in and the county seat of Bamberg County, South Carolina, United States. The population was 3,607 at the 2010 census.

<span class="mw-page-title-main">Govan, South Carolina</span> Town in South Carolina, United States

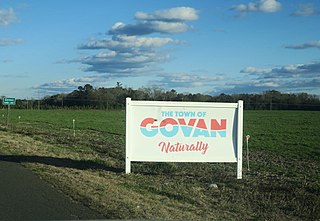
Govan is a town in Bamberg County, South Carolina, United States. The population was 65 at the 2010 census.

<span class="mw-page-title-main">Blackville, South Carolina</span> Town in South Carolina, United States

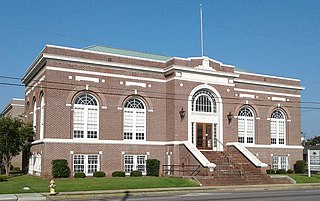
Blackville is a small town in Barnwell County, South Carolina, United States. The population was 2,406 at the 2010 census.

References

  1. "History of Bamberg County". www.bambergcountysc.gov. Retrieved June 13, 2022.
  2. 1 2 3 "QuickFacts: Bamberg County, South Carolina". United States Census Bureau. Retrieved March 22, 2024.
  3. "Find a County". National Association of Counties. Archived from the original on May 31, 2011. Retrieved June 7, 2011.
  4. Article VII Archived March 31, 2009, at the Wayback Machine – Counties and County Government of the South Carolina Constitution
  5. Lawrence 2003: Chapter 6 – 1897–1899 Bamberg County Created.
  6. "2020 County Gazetteer Files – South Carolina". United States Census Bureau. August 23, 2022. Retrieved September 10, 2023.
  7. "SCDNR Public Lands". www2.dnr.sc.gov. Retrieved April 1, 2023.
  8. "U.S. Decennial Census". United States Census Bureau. Retrieved March 16, 2015.
  9. "Historical Census Browser". University of Virginia Library. Retrieved March 16, 2015.
  10. Forstall, Richard L., ed. (March 27, 1995). "Population of Counties by Decennial Census: 1900 to 1990". United States Census Bureau. Retrieved March 16, 2015.
  11. "Census 2000 PHC-T-4. Ranking Tables for Counties: 1990 and 2000" (PDF). United States Census Bureau. April 2, 2001. Archived (PDF) from the original on October 9, 2022. Retrieved March 16, 2015.
  12. 1 2 "State & County QuickFacts". United States Census Bureau. Archived from the original on June 6, 2011. Retrieved November 22, 2013.
  13. "Explore Census Data". data.census.gov. Retrieved December 14, 2021.
  14. 1 2 3 "DP-1 Profile of General Population and Housing Characteristics: 2010 Demographic Profile Data". United States Census Bureau. Archived from the original on February 13, 2020. Retrieved March 9, 2016.
  15. "Population, Housing Units, Area, and Density: 2010 – County". United States Census Bureau. Archived from the original on February 13, 2020. Retrieved March 9, 2016.
  16. "DP02 Selected Social Characteristics in the United States – 2006–2010 American Community Survey 5-Year Estimates". United States Census Bureau. Archived from the original on February 13, 2020. Retrieved March 9, 2016.
  17. "DP03 Selected Economic Characteristics – 2006–2010 American Community Survey 5-Year Estimates". United States Census Bureau. Archived from the original on February 13, 2020. Retrieved March 9, 2016.
  18. "U.S. Census website". United States Census Bureau . Retrieved May 14, 2011.
  19. US Census Bureau Demographics Data
  20. Leip, David. "Dave Leip's Atlas of U.S. Presidential Elections". uselectionatlas.org. Retrieved March 13, 2018.
  21. U.S. Bureau of Economic Analysis (January 1, 2001). "Gross Domestic Product: All Industries in Bamberg County, SC". FRED, Federal Reserve Bank of St. Louis. Retrieved April 29, 2024.
  22. U.S. Bureau of Economic Analysis (January 1, 2001). "Real Gross Domestic Product: All Industries in Bamberg County, SC". FRED, Federal Reserve Bank of St. Louis. Retrieved April 29, 2024.
  23. U.S. Bureau of Labor Statistics (January 1, 1990). "Unemployment Rate in Bamberg County, SC". FRED, Federal Reserve Bank of St. Louis. Retrieved April 29, 2024.
  24. 1 2 "Bamberg County" (PDF). Community Profile. Columbia, SC: S.C. Department of Employment & Workforce - Business Intelligence Department. April 19, 2024.

Other sources