
The U.S. state of South Carolina is located in the Southern United States. It is the 23rd largest state by population, with a population of 5,024,369 according to 2017 United States Census estimates.
The U.S. state of South Carolina is located in the Southern United States. It is the 23rd largest state by population, with a population of 5,024,369 according to 2017 United States Census estimates.
| Census | Pop. | Note | %± |
|---|---|---|---|
| 1790 | 249,073 | — | |
| 1800 | 345,591 | 38.8% | |
| 1810 | 415,115 | 20.1% | |
| 1820 | 502,741 | 21.1% | |
| 1830 | 581,185 | 15.6% | |
| 1840 | 594,398 | 2.3% | |
| 1850 | 668,507 | 12.5% | |
| 1860 | 703,708 | 5.3% | |
| 1870 | 705,606 | 0.3% | |
| 1880 | 995,577 | 41.1% | |
| 1890 | 1,151,149 | 15.6% | |
| 1900 | 1,340,316 | 16.4% | |
| 1910 | 1,515,400 | 13.1% | |
| 1920 | 1,683,724 | 11.1% | |
| 1930 | 1,738,765 | 3.3% | |
| 1940 | 1,899,804 | 9.3% | |
| 1950 | 2,117,027 | 11.4% | |
| 1960 | 2,382,594 | 12.5% | |
| 1970 | 2,590,516 | 8.7% | |
| 1980 | 3,121,820 | 20.5% | |
| 1990 | 3,486,703 | 11.7% | |
| 2000 | 4,012,012 | 15.1% | |
| 2010 | 4,625,384 | 15.3% | |
| 2020 | 5,118,425 | 10.7% | |
| Source: 1910–2020 [1] | |||
South Carolina's center of population is 2.4 mi (3.9 km) north of the State House in the city of Columbia. [2]
According to the United States Census Bureau, as of 2017, South Carolina had an estimated population of 5,024,369, which is an increase of 64,547 from the prior year and an increase of 399,005, or 8.6%, since the year 2010. Immigration from outside the United States resulted in a net increase of 36,401 people, and migration within the country produced a net increase of 115,084 people.
According to the University of South Carolina's Arnold School of Public Health, Consortium for Latino Immigration Studies, South Carolina's foreign-born population grew faster than any other state between 2000 and 2005. [3] The Consortium reports that the number of Hispanics in South Carolina is greatly undercounted by census enumerators and may be more than 400,000. [3] [4]
| By race | White | Black | AIAN* | Asian | NHPI* |
|---|---|---|---|---|---|
| 2000 (total population) | 68.88% | 30.01% | 0.69% | 1.13% | 0.10% |
| 2000 (Hispanic only) | 2.05% | 0.26% | 0.05% | 0.03% | 0.02% |
| 2005 (total population) | 69.12% | 29.68% | 0.69% | 1.31% | 0.10% |
| 2005 (Hispanic only) | 2.95% | 0.27% | 0.06% | 0.04% | 0.02% |
| Growth 2000–05 (total population) | 6.43% | 4.89% | 6.09% | 23.49% | 13.76% |
| Growth 2000–05 (non-Hispanic only) | 5.01% | 4.87% | 4.61% | 23.16% | 10.36% |
| Growth 2000–05 (Hispanic only) | 52.78% | 7.64% | 23.97% | 34.25% | 26.89% |
| * AIAN is American Indian or Alaskan Native; NHPI is Native Hawaiian or Pacific Islander | |||||
South Carolina’s population increased by 15.4 percent between 1990 and 2000 and by another 7.4 percent between 2000 and 2005; 11.6 percent of that increase has been attributed to immigration, primarily from Mexico and Latin America. Most work in the construction industry, with another proportion in agriculture, in addition to processing factories. The Latino population has increased considerably faster in South Carolina and the Southeast than for the United States as a whole. [5]
The five largest ancestry groups in South Carolina identified by respondents to the US census are African American (29.5%), American (13.9%), English (8.4%), German (8.4%), and Irish (7.9%) (thus a total of more than 39% from northern Europe). [6]
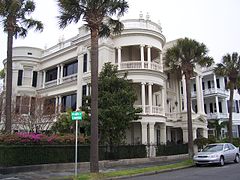
From 1720 until 1920, African slaves and their descendants made up a majority of the state's population. (See census data below.) Whites became a majority in the state after that date, following the migration of tens of thousands of blacks to northern industrial cities in the Great Migration. In the 21st century, most of the African-American population in the state lives in the Lowcountry and the Midlands areas, historically areas of their greatest concentrations of population.[ citation needed ]
6.6% of South Carolina's total population were reported as under 5 years old, 25.2% under 18, and 12.1% were 65 or older. Females made up approximately 51.4% of the population in 2000. Those who self-identify as having American ancestry are of mostly British Isles ancestry: English and Scots-Irish stock.[ citation needed ]
Note: Births in table do not add up, because Hispanics are counted both by their ethnicity and by their race, giving a higher overall number.
| Race | 2013 [7] | 2014 [8] | 2015 [9] | 2016 [10] | 2017 [11] | 2018 [12] | 2019 [13] | 2020 [14] | 2021 [15] | 2022 [16] |
|---|---|---|---|---|---|---|---|---|---|---|
| White (NH) | 33,085 (58.2%) | 33,639 (58.4%) | 33,927 (58.4%) | 32,929 (57.4%) | 32,283 (56.6%) | 31,890 (56.3%) | 31,660 (55.5%) | 30,465 (54.7%) | 31,841 (55.7%) | 32,323 (55.9%) |
| Black | 18,591 (32.7%) | 18,598 (32.3%) | 18,577 (32.0%) | 16,527 (28.8%) | 16,851 (29.5%) | 16,681 (29.4%) | 16,802 (29.5%) | 16,309 (29.3%) | 16,009 (28.0%) | 15,333 (26.5%) |
| Asian | 1,235 (2.2%) | 1,293 (2.2%) | 1,289 (2.2%) | 1,134 (2.0%) | 1,125 (2.0%) | 1,172 (2.1%) | 1,155 (2.0%) | 1,148 (2.1%) | 1,167 (2.0%) | 1,176 (2.0%) |
| American Indian | 201 (0.3%) | 193 (0.3%) | 217 (0.4%) | 151 (0.3%) | 183 (0.3%) | 156 (0.3%) | 176 (0.3%) | 106 (0.2%) | 122 (0.2%) | 198 (0.3%) |
| Hispanic (of Native American race) | 4,411 (7.8%) | 4,646 (8.1%) | 4,942 (8.5%) | 5,135 (8.9%) | 5,221 (9.2%) | 5,255 (9.3%) | 5,741 (10.1%) | 5,993 (10.7%) | 6,386 (11.2%) | 7,073 (12.2%) |
| Total South Carolina | 56,795 (100%) | 57,627 (100%) | 58,139 (100%) | 57,342 (100%) | 57,029 (100%) | 56,669 (100%) | 57,038 (100%) | 55,704 (100%) | 57,185 (100%) | 57,820 (100%) |

| County | Seat | 2000 Population | 2010 Population | 2017 Population |
|---|---|---|---|---|
| Greenville | Greenville | 379,616 | 451,225 | 506,837 |
| Richland | Columbia | 320,667 | 384,504 | 411,592 |
| Charleston | Charleston | 309,969 | 350,209 | 401,438 |
| Horry | Conway | 196,629 | 269,291 | 333,268 |
| Spartanburg | Spartanburg | 253,431 | 284,307 | 306,854 |
| Lexington | Lexington | 216,014 | 254,920 | 290,642 |
| York | York | 164,614 | 229,073 | 266,439 |
| Berkeley | Moncks Corner | 142,651 | 177,843 | 217,937 |
| Anderson | Anderson | 165,740 | 187,126 | 198,759 |
| Beaufort | Beaufort | 120,937 | 162,233 | 186,844 |


Population estimates as of 2010.
South Carolina's metropolitan statistical areas (MSAs) are much larger than their central city population counts suggest. South Carolina law makes it difficult for municipalities to annex unincorporated areas, so city proper populations look smaller than is reflected in the total metropolitan populations.
For example, Myrtle Beach has a municipal population of less than 50,000 persons, but its MSA has more than 200,000 persons. Anderson's municipal population is smaller than Sumter's, but the Anderson MSA is larger, as seen below.
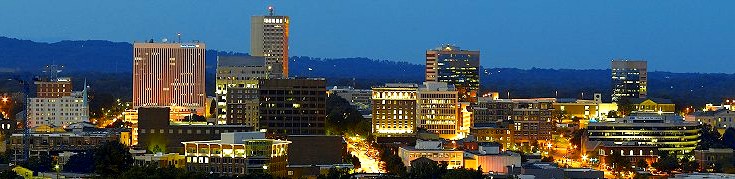
Columbia, Charleston, and Greenville all have urbanized area populations between 400,000 and 550,000, while their metropolitan statistical area (MSA) populations are each more than 600,000. The Greenville-Spartanburg-Anderson MSA population consists of approximately 1.4 million people, making it the largest in the state and third largest in the Carolinas.
As of 2010: [17]

South Carolina residents are majority Protestant Christian, with a lower percentage of people claiming no religious affiliation than the national average. The religious affiliations of the people of South Carolina are as follows:
Sephardic Jews have lived in the state for more than 300 years, [19] [20] [21] especially in and around Charleston. Many came from London, where they were merchants. [22] Until about 1830, South Carolina had the largest population of Jews in North America, most in Charleston. Some have married and assimilated into Christian society; in the 21st century, less than 1% of the total religiously affiliated people are Jewish. The proportion of Roman Catholics in the state has been increasing given migrants from the North and immigration from Latin America.
Beginning in 1790, the United States Census Bureau collected the population statistics of South Carolina. The years listed prior to that are estimates and exclude the Native American population. From 1790 until 1860, the designated demographic classifications were white, black slave and free black.
Graphs are unavailable due to technical issues. There is more info on Phabricator and on MediaWiki.org. |
Following the Civil War, the racial groupings were white, black and other.
Graphs are unavailable due to technical issues. There is more info on Phabricator and on MediaWiki.org. |
The following is a list of census data for the state of South Carolina: [23]
| Census Year | Demographic | Population | % of Pop. | % Growth |
|---|---|---|---|---|
| 1670 | White | 140 | 90.3% | – |
| Slave | 15 | 9.7% | – | |
| Total | 155 | 100% | - | |
| 1680 | White | 1,000 | 83.3% | +614.3% |
| Slave | 200 | 16.7% | +1233.3% | |
| Total | 1,200 | 100% | +674.2% | |
| 1700 | White | 3,100 | 56.4% | +210.0% |
| Slave | 2,400 | 43.6% | +1100.0% | |
| Total | 5,500 | 100% | +358.3% | |
| 1708 | White | 4,080 | 42.6% | +31.6% |
| Black Slaves | 4,100 | 42.8% | – | |
| Indian Slaves | 1,400 | 14.6% | – | |
| Total | 9,580 | 100% | +74.2% | |
| 1720 | White | 6,500 | 35.1% | +59.3% |
| Slave | 12,000 | 64.9% | +118.2% | |
| Total | 18,500 | 100% | +93.1% | |
| 1730 | White | 10,000 | 33.3% | +53.9% |
| Slave | 20,000 | 66.7% | +66.7% | |
| Total | 30,000 | 100% | +62.2% | |
| 1740 | White | 20,000 | 33.3% | +100.0% |
| Slave | 40,000 | 66.7% | +100.0% | |
| Total | 60,000 | 100% | +100.0% | |
| 1750 | White | 21,667 | 33.3% | +8.3% |
| Slave | 43,333 | 66.7% | +8.3% | |
| Total | 65,000 | 100% | +8.3% | |
| 1760 | White | 32,000 | 38.1% | +47.7% |
| Slave | 52,000 | 61.9% | +20.0% | |
| Total | 84,000 | 100% | +29.2% | |
| 1770 | White | 50,000 | 38.5% | +56.3% |
| Slave | 80,000 | 61.5% | +53.9% | |
| Total | 130,000 | 100% | +54.7% | |
| 1780 | White | 83,000 | 46.1% | +66.0% |
| Slave | 97,000 | 53.9% | +21.3% | |
| Total | 180,000 | 100% | +38.5% | |
| 1790 | White | 140,178 | 56.3% | +68.9% |
| Slave | 107,094 | 43.0% | +10.4% | |
| Free Black | 1,801 | 0.7% | – | |
| Total | 249,073 | 100% | +38.4% | |
| 1800 | White | 196,255 | 56.8% | +40.0% |
| Slave | 146,151 | 42.3% | +36.5% | |
| Free Black | 3,185 | 0.9% | +76.9% | |
| Total | 345,591 | 100% | +38.8% | |
| 1810 | White | 214,196 | 51.6% | +9.1% |
| Slave | 196,365 | 47.3% | +34.4% | |
| Free Black | 4,554 | 1.1% | +42.9% | |
| Total | 415,115 | 100% | +20.1% | |
| 1820 | White | 237,440 | 47.2% | +10.9% |
| Slave | 258,475 | 51.4% | +31.6% | |
| Free Black | 6,826 | 1.4% | +49.9% | |
| Total | 502,741 | 100% | +21.1% | |
| 1830 | White | 257,863 | 44.4% | +8.6% |
| Slave | 323,322 | 55.6% | +25.1% | |
| Total | 581,185 | 100% | +15.6% | |
| 1840 | White | 259,084 | 43.6% | +0.5% |
| Slave | 327,038 | 55.0% | +1.2% | |
| Free Black | 8,276 | 1.4% | +21.2% | |
| Total | 594,398 | 100% | +2.3% | |
| 1850 | White | 274,563 | 41.1% | +6.0% |
| Slave | 393,944 | 58.9% | +20.5% | |
| Total | 668,507 | 100% | +12.5% | |
| 1860 | White | 271,300 | 41.4% | +6.1% |
| Slave | 487,406 | 57.2% | +2.2% | |
| Free Black | 9,914 | 1.4% | +19.8% | |
| Other | 88 | 0.0% | – | |
| Total | 703,708 | 100% | +5.3% | |
| 1870 | White | 289,667 | 41.1% | -0.6% |
| Black | 465,814 | 58.9% | +3.3% | |
| Other | 125 | 0.0% | +42.1% | |
| Total | 705,606 | 100% | +0.3% | |
| 1880 | White | 391,105 | 39.3% | +35.0% |
| Black | 604,332 | 60.7% | +45.3% | |
| Other | 140 | 0.0% | +12.0% | |
| Total | 995,577 | 100% | +41.1% | |
| 1890 | White | 462,008 | 40.1% | +18.1% |
| Black | 728,934 | 59.9% | +14.0% | |
| Other | 207 | 0.0% | +47.9% | |
| Total | 1,151,149 | 100% | +15.6% | |
| 1900 | White | 547,807 | 41.6% | +20.7% |
| Black | 789,321 | 58.4% | +13.6% | |
| Other | 188 | 0.0% | -9.2% | |
| Total | 1,340,316 | 100% | +16.4% | |
| 1910 | White | 679,161 | 44.9% | +21.8% |
| Black | 833,843 | 55.1% | +6.6% | |
| Other | 396 | 0.0% | +110.6% | |
| Total | 1,515,400 | 100% | +13.1% | |
| 1920 | White | 878,538 | 51.4% | +20.5% |
| Black | 864,719 | 48.6% | +3.7% | |
| Other | 467 | 0.0% | +17.9% | |
| Total | 1,683,724 | 100% | +11.1% | |
| 1930 | White | 994,049 | 54.3% | +15.3% |
| Black | 693,681 | 45.6% | -8.2% | |
| Other | 1,035 | 0.1% | +121.6% | |
| Total | 1,738,765 | 100% | +3.3% | |
| 1940 | White | 1,084,308 | 57.1% | +14.9% |
| Black | 714,164 | 42.9% | +2.6% | |
| Other | 1,332 | 0.1% | +28.7% | |
| Total | 1,899,804 | 100% | +9.3% | |
| 1950 | White | 1,293,405 | 61.1% | +19.3% |
| Black | 722,077 | 38.8% | +1.0% | |
| Other | 1,545 | 0.1% | +16.0% | |
| Total | 2,117,027 | 100% | +11.4% | |
| 1960 | White | 1,551,022 | 65.1% | +19.9% |
| Black | 829,291 | 34.8% | +0.9% | |
| Other | 2,281 | 0.1% | +47.6% | |
| Total | 2,382,594 | 100% | +12.5% | |
| 1970 | White | 1,794,430 | 69.3% | +15.7% |
| Black | 789,041 | 30.4% | -4.9% | |
| Other | 7,045 | 0.3% | +208.9% | |
| Total | 2,590,516 | 100% | +8.7% | |
| 1980 | White | 2,147,224 | 68.8% | +19.7% |
| Black | 948,623 | 30.4% | +20.2% | |
| Other | 25,973 | 0.8% | +268.7% | |
| Total | 3,121,820 | 100% | +20.5% | |
| 1990 | White | 2,406,974 | 69.0% | +12.1% |
| Black | 1,039,884 | 29.8% | +9.6% | |
| Other | 39,845 | 1.2% | +53.4% | |
| Total | 3,486,703 | 100% | +11.7% | |
| 2000 | White | 2,695,560 | 67.2% | +12.0% |
| Black | 1,185,216 | 29.5% | +14.0% | |
| Other | 131,236 | 3.3% | +229.4% | |
| Total | 4,012,012 | 100% | +15.1% | |
| 2010 | White | 3,062,000 | 66.2% | +13.6% |
| Black | 1,290,684 | 27.9% | +8.9% | |
| Other | 274,680 | 5.9% | +109.3% | |
| Total | 4,625,364 | 100% | +15.3% |

South Carolina is a state in the coastal Southeastern region of the United States. It borders North Carolina to the north, the Atlantic Ocean to the southeast, and Georgia to the southwest across the Savannah River. Along with North Carolina, it makes up the Carolinas region of the East Coast. South Carolina is the 40th-largest and 23rd-most populous U.S. state with a recorded population of 5,118,425 according to the 2020 census. In 2019, its GDP was $213.45 billion. South Carolina is composed of 46 counties. The capital is Columbia with a population of 136,632 in 2020; while its most populous city is Charleston with a 2020 population of 150,227. The Greenville-Spartanburg-Anderson, SC Combined Statistical Area is the most populous combined metropolitan area in the state, with an estimated 2023 population of 1,590,636.

The United States had an official estimated resident population of 334,914,895 on July 1, 2023, according to the U.S. Census Bureau. This figure includes the 50 states and the District of Columbia but excludes the population of five unincorporated U.S. territories as well as several minor island possessions. The United States is the third most populous country in the world, and the most populous in the Americas and the Western Hemisphere. The Census Bureau showed a population increase of 0.4% for the twelve-month period ending in July 2022, below the world average annual rate of 0.9%. The total fertility rate in the United States estimated for 2022 is 1.665 children per woman, which is below the replacement fertility rate of approximately 2.1.

Spartanburg County is a county located on the northwestern border of the U.S. state of South Carolina. As of the 2020 census, the population was 327,997, making it the fifth-most populous county in South Carolina. Its county seat is Spartanburg.

Richland County is located in the U.S. state of South Carolina. As of the 2020 census, its population was 416,147, making it the second-most populous county in South Carolina, behind only Greenville County. The county seat and largest community is Columbia, the state capital. The county was established on March 12, 1785. Richland County is part of the Columbia, SC Metropolitan Statistical Area. In 2020, the center of population of South Carolina was located in Richland County, in the city of Columbia. The county is also the location of the geographic center of South Carolina, southeast of Columbia.

Greenville County is located in the U.S. state of South Carolina. As of the 2020 census, the population was 525,534, making it the most populous county in the state. Its county seat is Greenville. The county is also home to the Greenville County School District, the largest school system in South Carolina.

Cherokee County is a county in the U.S. state of South Carolina. As of the 2020 census, the population was 56,216. The county seat is Gaffney. The county was formed in 1897 from parts of York, Union, and Spartanburg counties. It was named for the Cherokee people who historically occupied this area prior to European encounter.

Gaffney is a city in and the seat of Cherokee County, South Carolina, United States, in the Upstate region of South Carolina. Gaffney is known as the "Peach Capital of South Carolina". The population was 12,539 at the 2010 census, with an estimated population of 12,609 in 2019. It is the principal city of the Gaffney, South Carolina, Micropolitan Statistical Area, which includes all of Cherokee County and which is further included in the greater Greenville-Spartanburg-Anderson, South Carolina Combined Statistical Area.

Greer is a city in Greenville and Spartanburg counties in the U.S. state of South Carolina. The population was 35,308 as of the 2020 census, making it the 14th-most populous city in South Carolina. Greer is included in the Greenville-Anderson-Greer, SC Metropolitan Statistical Area, which is part of the Greenville-Spartanburg-Anderson, SC Combined Statistical Area in Upstate South Carolina.

Mexican Americans are Americans of Mexican heritage. In 2022, Mexican Americans comprised 11.2% of the US population and 58.9% of all Hispanic and Latino Americans. In 2019, 71% of Mexican Americans were born in the United States; they make up 53% of the total population of foreign-born Hispanic Americans and 25% of the total foreign-born population. Chicano is a term used by some to describe the unique identity held by Mexican-Americans. The United States is home to the second-largest Mexican community in the world, behind only Mexico. Most Mexican Americans reside in the Southwest, with over 60% of Mexican Americans living in the states of California and Texas.
Greenville–Spartanburg International Airport is near Greer, South Carolina, United States, midway between Greenville and Spartanburg, the major cities of the Upstate region. The airport is the third-busiest airport in South Carolina, after Charleston International Airport, and Myrtle Beach International Airport with over 2.56 million passengers in 2023.

The Upstate, historically known as the Upcountry, is a region of the U.S. state of South Carolina, comprising the northwesternmost area of the state. Although loosely defined among locals, the general definition includes the 10 counties of the commerce-rich I-85 corridor in the northwest corner of South Carolina. This definition coincided with the Greenville-Spartanburg-Anderson, SC Combined Statistical Area, as first defined by the Office of Management and Budget (OMB) in 2015. In 2023, the OMB issued its most updated definition of the CSA that coincides again with the 10-county region.
According to the U.S. Census Bureau, as of 2023, Texas was the second largest state in population after California, with a population of 30,503,301, an increase of more than 1.3 million people, or 4.7%, since the 29,145,505 of the 2020 census. Its apportioned population in 2020 was 29,183,290. Since the beginning of the 21st century, the state of Texas has experienced strong population growth. Texas has many major cities and metropolitan areas, along with many towns and rural areas. Much of the population is concentrated in the major cities of Dallas–Fort Worth, Austin, San Antonio, Houston, McAllen, and El Paso and their corresponding metropolitan areas. The first four aforementioned main urban centers are also referred to as the Texas Triangle megaregion.

According to the U.S. Census Bureau, as of 2023, New York was the fourth largest state in population after California, Texas, and Florida, with a population of 19,571,216, a decrease of over 600,000 people, or −3.1%, since the 2020 census. The population change between 2000–2006 includes a natural increase of 601,779 people and a decrease due to net migration of 422,481 people out of the state. Immigration from outside the United States resulted in a net increase of 820,388 people, and migration within the country produced a net loss of about 800,213.

As of 2020, Alaska has a population of 733,391.
Tennessee is the fifteenth most populous state in the United States with a population of 7,051,339 as of 2022, and has the twentieth-highest population density. The 2020 United States census reported its population to be 6,916,897.
Demographics of North Carolina covers the varieties of ethnic groups who reside in North Carolina and relevant trends.

The Augusta metropolitan area, officially the Augusta-Richmond County metropolitan statistical area according to the U.S. Office of Management and Budget, Census Bureau and other agencies, is a metropolitan statistical area centered on the city of Augusta, Georgia. It straddles two U.S. states, Georgia and South Carolina, and includes the Georgia counties of Richmond, Burke, Columbia, Lincoln, and McDuffie as well as the South Carolina counties of Aiken and Edgefield. The official 2023 U.S. census estimate for the area was 629,429 residents, up from 611,000 at the 2020 U.S. census.
Caesars Head is an unincorporated community and census-designated place (CDP) on top of Caesars Head, a mountain in Greenville County, South Carolina, United States. It was first listed as a CDP in the 2020 census with a population of 84.

Non-Hispanic Whites, Non-Latino Whites, or more simply White Americans, are Americans classified by the United States census as "white" and not Hispanic. According to the United States Census Bureau yearly estimates, as of July 1, 2022, Non-Hispanic whites make up about 59.3% of the U.S. population, or 197,639,521 people. The United States Census Bureau defines white to include European Americans, Middle Eastern Americans, and North African Americans. Americans of European ancestry are divided into various ethnic groups. More than half of the white population are German, Irish, English, French and Polish Americans. Many Americans are also the product of other European groups that migrated to parts of the US in the 19th and 20th centuries, as the bulk of immigrants from various countries in Northern, Central, Eastern, and Southeastern Europe, as well as the Caucasus region, migrated to the United States.
The racial and ethnic demographics of the United States have changed dramatically throughout its history.