1996 United States presidential election in North Carolina

Last updated

1996 United States presidential election in North Carolina
Flag of North Carolina.svg
  1992 November 5, 1996 2000  
  Ks 1996 dole (cropped).jpg Bill Clinton.jpg RossPerotColor.jpg
Nominee Bob Dole Bill Clinton Ross Perot
Party Republican Democratic Reform
Home state Kansas Arkansas Texas
Running mate Jack Kemp Al Gore Pat Choate
Electoral vote1400
Popular vote1,225,9381,107,849168,059
Percentage48.73%44.04%6.68%

North Carolina Presidential Election Results 1996.svg
1996 United States presidential election in North Carolina results map by congressional district.svg

President before election

Bill Clinton
Democratic

Elected President

Bill Clinton
Democratic

The 1996 United States presidential election in North Carolina took place on 5 November 1996 as part of the 1996 United States presidential election. Voters in North Carolina chose 14 representatives, or electors to the Electoral College, who voted for president and vice president.

Contents

North Carolina was narrowly won by the Republican nominee, Senator Bob Dole of Kansas, defeating incumbent Democratic President Bill Clinton of Arkansas. Dole won with a plurality of 48.73% of the vote to Clinton's 44.04%, a margin of 4.69%. The Reform Party candidate, billionaire businessman Ross Perot, came in a distant third, with 6.68%.

In 1992, Clinton became the first Democrat to win the White House without carrying North Carolina since the founding of the Republican Party and the only Democrat to ever secure two terms in office without North Carolina. Although the state remained competitive in 1996, Dole improved non-trivially on George H. W. Bush's margin on his way to becoming the second losing Republican to carry the state, reflecting the state's increasingly Republican orientation. Much of Dole's strength came from wins in large counties anchored by, or adjoining, an urban area. He flipped Wake County, home of Raleigh and the largest county in the nation he flipped outside California, carrying it by 2.3%. His top two raw vote margins in the state came from Gaston County, a suburban county adjoining Mecklenburg County (home of Charlotte), and Forsyth County, home of Winston-Salem; in the latter, he increased Bush's '92 margin of 3.2% to 11.3%. He also shrank Bill Clinton's margin in Guilford County, home of Greensboro, from 4.2% to 1.0%. (Clinton did, however, flip Mecklenburg County itself.)

As of the 2020 presidential election , this is the last election in which the following counties have voted for a Democratic presidential candidate: Camden, Duplin, Franklin, Haywood, Jones, Madison, Montgomery, Perquimans and Swain. [1]

Results

1996 United States presidential election in North Carolina [2]
PartyCandidateVotes%±%
Republican Bob Dole 1,225,938 48.73 +5.29
Democratic Bill Clinton (incumbent)1,107,84944.04+1.39
Reform Ross Perot 168,0596.68+6.68
Libertarian Harry Browne 8,7400.35+0.15
Natural Law John Hagelin 2,7710.11+0.11
Independent Ralph Nader (write-in)2,1080.08
Independent Howard Phillips (write-in)2580.01
Independent James Harris (write-in)840.00
Turnout 2,515,807

Results by county

County [3] Bob Dole
Republican
Bill Clinton
Democratic
Ross Perot
Reform
Harry Browne
Libertarian
Various candidates
Other parties
MarginTotal
# %# %# %# %# %# %
Alamance 22,46153.66%15,81437.78%3,3958.11%1450.35%460.11%6,64715.88%41,861
Alexander 6,74857.53%3,95533.72%1,0048.56%150.13%80.07%2,79323.81%11,730
Alleghany 1,93645.71%1,80142.53%45810.81%320.76%80.19%1353.18%4,235
Anson 2,19328.77%4,89064.15%5126.72%200.26%80.10%-2,697-35.38%7,623
Ashe 5,20352.33%3,82538.47%8658.70%290.29%200.20%1,37813.86%9,942
Avery 3,87062.83%1,58625.75%65510.63%280.45%200.32%2,28437.08%6,159
Beaufort 8,15453.59%6,17240.57%8345.48%350.23%200.13%1,98213.02%15,215
Bertie 1,74527.83%4,20267.01%3165.04%60.10%20.03%-2,457-39.18%6,271
Bladen 3,33537.22%4,95255.27%6557.31%100.11%80.09%-1,617-18.05%8,960
Brunswick 10,06545.70%10,04145.59%1,8158.24%750.34%270.12%240.11%22,023
Buncombe 30,51844.19%31,65845.84%6,2549.05%3350.49%3020.44%-1,140-1.65%69,067
Burke 13,85348.97%11,67841.28%2,6549.38%760.27%300.11%2,1757.69%28,291
Cabarrus 23,03555.76%14,44734.97%3,6268.78%1320.32%700.17%8,58820.79%41,310
Caldwell 12,65355.18%8,05035.11%2,0999.15%480.21%810.35%4,60320.07%22,931
Camden 1,07441.86%1,18646.22%29311.42%70.27%60.23%-112-4.36%2,566
Carteret 11,72156.15%7,56636.24%1,4677.03%750.36%470.23%4,15519.91%20,876
Caswell 3,31040.57%4,31252.86%5106.25%160.20%100.12%-1,002-12.29%8,158
Catawba 26,89858.03%15,60133.66%3,6297.83%1710.37%550.12%11,29724.37%46,354
Chatham 7,73142.03%9,35350.84%1,1136.05%1030.56%960.52%-1,622-8.81%18,396
Cherokee 3,88349.26%3,12939.69%7859.96%330.42%530.67%7549.57%7,883
Chowan 1,65938.80%2,23952.36%3598.40%140.33%50.12%-580-13.56%4,276
Clay 1,76948.40%1,46240.00%38710.59%310.85%60.16%3078.40%3,655
Cleveland 13,47447.71%12,72845.07%1,9316.84%710.25%370.13%7462.64%28,241
Columbus 6,01736.96%9,01955.40%1,1707.19%690.42%50.03%-3,002-18.44%16,280
Craven 13,26452.65%10,31740.96%1,5286.07%660.26%160.06%2,94711.69%25,191
Cumberland 29,80444.83%32,73949.25%3,7765.68%1140.17%460.07%-2,935-4.42%66,479
Currituck 2,56945.51%2,27740.34%77013.64%240.43%50.09%2925.17%5,645
Dare 4,97746.00%4,52241.79%1,25811.63%330.30%300.28%4554.21%10,820
Davidson 24,79758.75%13,59332.21%3,6988.76%890.21%300.07%11,20426.54%42,207
Davie 8,14164.51%3,52527.93%9157.25%270.21%120.10%4,61636.58%12,620
Duplin 5,43243.83%6,17949.86%7666.18%140.11%10.01%-747-6.03%12,392
Durham 27,82534.39%49,18660.79%3,1223.86%3320.41%4450.55%-21,361-26.40%80,910
Edgecombe 6,01034.78%10,56861.16%6603.82%310.18%90.05%-4,558-26.38%17,278
Forsyth 59,16052.81%46,54341.54%5,7475.13%4090.37%1740.16%12,61711.27%112,033
Franklin 5,64843.36%6,44849.50%8916.84%290.22%100.08%-800-6.14%13,026
Gaston 33,14958.42%19,45834.29%3,9216.91%1580.28%530.09%13,69124.13%56,739
Gates 1,07230.27%2,15560.84%3078.67%60.17%20.06%-1,083-30.57%3,542
Graham 1,80154.76%1,21036.79%2708.21%40.12%40.12%59117.97%3,289
Granville 5,49842.95%6,74752.71%4323.38%1100.86%130.10%-1,249-9.76%12,800
Greene 2,68951.73%2,22442.79%2805.39%20.04%30.06%4658.94%5,198
Guilford 67,72745.89%69,20846.89%9,7396.60%6050.41%3080.21%-1,481-1.00%147,587
Halifax 5,70035.40%9,55159.31%8165.07%240.15%120.07%-3,851-23.91%16,103
Harnett 11,59653.34%8,76740.33%1,2875.92%330.15%560.26%2,82913.01%21,739
Haywood 7,99539.84%9,35046.59%2,59412.93%770.38%530.26%-1,355-6.75%20,069
Henderson 19,18258.70%10,62632.52%2,6798.20%1350.41%540.17%8,55626.18%32,676
Hertford 1,82325.86%4,85668.89%3565.05%70.10%70.10%-3,033-43.03%7,049
Hoke 1,91432.28%3,51059.20%4818.11%140.24%100.17%-1,596-26.92%5,929
Hyde 78238.30%1,10954.31%1437.00%60.29%20.10%-327-16.01%2,042
Iredell 21,16356.57%13,10235.02%2,9707.94%1140.30%600.16%8,06121.55%37,409
Jackson 4,24440.40%5,21149.60%9709.23%510.49%300.29%-967-9.20%10,506
Johnston 18,70458.23%11,17534.79%2,1636.73%550.17%220.07%7,52923.44%32,119
Jones 1,68245.28%1,82949.23%1975.30%50.13%20.05%-147-3.95%3,715
Lee 7,32150.04%6,29042.99%9806.70%280.19%110.08%1,0317.05%14,630
Lenoir 9,43349.84%8,63545.63%8224.34%230.12%120.06%7984.21%18,925
Lincoln 11,43954.86%7,72137.03%1,6197.76%430.21%280.13%3,71817.83%20,850
Macon 5,26749.34%4,20939.43%1,12110.50%440.41%340.32%1,0589.91%10,675
Madison 3,11044.24%3,33347.41%5387.65%160.23%330.47%-223-3.17%7,030
Martin 3,59041.98%4,50052.62%4455.20%150.18%20.02%-910-10.64%8,552
McDowell 6,40752.18%4,55337.08%1,27510.38%260.21%170.14%1,85415.10%12,278
Mecklenburg 97,71945.91%103,42948.59%10,4734.92%7720.36%4520.21%-5,710-2.68%212,845
Mitchell 3,87465.15%1,49625.16%5499.23%200.34%70.12%2,37839.99%5,946
Montgomery 3,37943.11%3,85649.20%5877.49%80.10%80.10%-477-6.09%7,838
Moore 14,76055.74%9,84737.19%1,7616.65%610.23%500.19%4,91318.55%26,479
Nash 15,30954.17%11,14239.42%1,7516.20%510.18%90.03%4,16714.75%28,262
New Hanover 27,88950.92%22,83941.70%3,6156.60%3220.59%1040.19%5,0509.22%54,769
Northampton 1,88125.08%5,20769.44%4025.36%80.11%10.01%-3,326-44.36%7,499
Onslow 13,39655.70%8,68536.11%1,8577.72%880.37%230.10%4,71119.59%24,049
Orange 15,05332.19%28,67461.32%1,5343.28%9061.94%5981.28%-13,621-29.13%46,765
Pamlico 2,27047.39%2,20446.01%2976.20%160.33%30.06%661.38%4,790
Pasquotank 2,99938.34%4,23354.12%5657.22%160.20%90.12%-1,234-15.78%7,822
Pender 5,53846.38%5,40945.30%9457.91%300.25%180.15%1291.08%11,940
Perquimans 1,56138.88%2,06951.53%3699.19%120.30%40.10%-508-12.65%4,015
Person 4,88348.68%4,54045.26%5915.89%130.13%30.03%3433.42%10,030
Pitt 18,22747.95%17,55546.18%2,0375.36%900.24%1020.27%6721.77%38,011
Polk 3,51652.04%2,70440.02%4937.30%300.44%130.19%81212.02%6,756
Randolph 23,03061.36%10,78328.73%3,5939.57%820.22%470.13%12,24732.63%37,535
Richmond 3,97331.04%7,56459.09%1,2309.61%160.12%180.14%-3,591-28.05%12,801
Robeson 8,14629.53%17,36162.95%2,0157.31%400.15%190.07%-9,215-33.42%27,581
Rockingham 14,25549.22%12,09641.77%2,5288.73%360.12%440.15%2,1597.45%28,959
Rowan 22,75457.94%13,46134.28%2,9027.39%1170.30%390.10%9,29323.66%39,273
Rutherford 9,79252.73%7,16238.57%1,5858.53%210.11%110.06%2,63014.16%18,571
Sampson 8,24147.82%8,15047.30%8254.79%120.07%40.02%910.52%17,232
Scotland 2,85834.44%4,87058.68%5486.60%110.13%120.14%-2,012-24.24%8,299
Stanly 11,44656.29%7,13135.07%1,6908.31%460.23%200.10%4,31521.22%20,333
Stokes 9,47161.82%4,76931.13%1,0256.69%450.29%100.07%4,70230.69%15,320
Surry 11,11755.53%7,30336.48%1,5387.68%440.22%190.09%3,81419.05%20,021
Swain 1,44438.80%1,86950.21%40110.77%60.16%20.05%-425-11.41%3,722
Transylvania 6,73452.29%4,84237.60%1,1839.19%540.42%640.50%1,89214.69%12,877
Tyrrell 48832.25%90860.01%1127.40%40.26%10.07%-420-27.76%1,513
Union 18,80257.03%11,52534.96%2,4777.51%1170.35%490.15%7,27722.07%32,970
Vance 4,65139.97%6,38554.88%5754.94%170.15%70.06%-1,734-14.91%11,635
Wake 108,78048.18%103,57445.88%11,8115.23%9790.43%6110.27%5,2062.30%225,755
Warren 1,86129.36%4,14165.33%3195.03%100.16%80.13%-2,280-35.97%6,339
Washington 1,56234.47%2,79061.56%1713.77%70.15%20.04%-1,228-27.09%4,532
Watauga 8,14647.30%7,34942.67%1,4158.22%1390.81%1731.00%7974.63%17,222
Wayne 16,58856.44%11,58039.40%1,1784.01%300.10%140.05%5,00817.04%29,390
Wilkes 12,39558.39%6,79332.00%1,9679.27%580.27%150.07%5,60226.39%21,228
Wilson 10,51849.03%9,77945.59%1,1005.13%310.14%230.11%7393.44%21,451
Yadkin 8,43968.54%2,92723.77%9137.41%220.18%120.10%5,51244.77%12,313
Yancey 3,97345.75%3,95645.56%7208.29%180.21%170.20%170.19%8,684
Totals1,225,93848.73%1,107,84944.04%168,0596.68%8,7400.35%5,2210.21%118,0894.69%2,515,807

Counties that flipped from Democratic to Republican

Counties that flipped from Republican to Democratic

Electors

Technically the voters of North Carolina cast their ballots for electors: representatives to the Electoral College. North Carolina was allocated 14 electors because it had 12 congressional districts and 2 senators. All candidates that appear on the ballot or qualify to receive write-in votes must submit a list of 14 electors, who pledge to vote for their candidate and his or her running mate. Whoever wins the majority of votes in the state is awarded all 14 electoral votes. Their chosen electors then vote for president and vice president. Although electors are pledged to their candidate and running mate, they are not obligated to vote for them. An elector who votes for someone other than his or her candidate is known as a faithless elector.

The following were the members of the Electoral College from the state. All were pledged to and voted for Bob Dole and Jack Kemp: [4]

  1. Howard B. Smith
  2. Bettie West
  3. J.D. Teachey
  4. Nelson Dollar
  5. Lee Q. McMillan
  6. Carolyn McGee
  7. Jim Cole
  8. Tom Dwiggins
  9. John Van Hanford
  10. Gary Whitener
  11. George Alexander Jones
  12. Quentine Finch
  13. Bill Graham
  14. Dorothy Bursey

Related Research Articles

<span class="mw-page-title-main">1996 United States presidential election</span> 53rd quadrennial U.S. presidential election

The 1996 United States presidential election was the 53rd quadrennial presidential election, held on Tuesday, November 5, 1996. Incumbent Democratic President Bill Clinton defeated former Senate Majority Leader Bob Dole, the Republican nominee, and Ross Perot, the Reform Party nominee and 1992 Independent presidential candidate.

<span class="mw-page-title-main">2004 United States presidential election in Iowa</span>

The 2004 United States presidential election in Iowa took place on November 2, 2004, as part of the 2004 United States presidential election in which all 50 states plus the District of Columbia participated. Voters chose seven electors to represent them in the Electoral College via a popular vote pitting incumbent Republican President George W. Bush and his running mate, Vice President Dick Cheney, against Democratic challenger and Senator from Massachusetts John F. Kerry and his running mate, Senator from North Carolina John Edwards. Six third parties were also on the ballot.

<span class="mw-page-title-main">2004 United States presidential election in Arkansas</span> Election in Arkansas

The 2004 United States presidential election in Arkansas took place on November 2, 2004, and was part of the 2004 United States presidential election. State voters chose six representatives, or electors to the Electoral College, who voted for president and vice president.

<span class="mw-page-title-main">2004 United States presidential election in Colorado</span> Election in Colorado

The 2004 United States presidential election in Colorado took place on November 2, 2004, and was part of the 2004 United States presidential election. Voters chose nine representatives, or electors to the Electoral College, who voted for president and vice president.

<span class="mw-page-title-main">2004 United States presidential election in North Carolina</span>

The 2004 United States presidential election in North Carolina took place on November 2, 2004, and was part of the 2004 United States presidential election. Voters chose 15 representatives, or electors to the Electoral College, who voted for president and vice president.

<span class="mw-page-title-main">2004 United States presidential election in Michigan</span> Election in Michigan

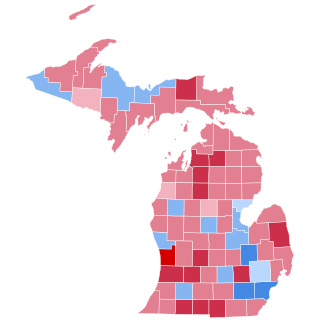
The 2004 United States presidential election in Michigan took place on November 2, 2004, and was part of the 2004 United States presidential election. Voters chose 17 representatives, or electors to the Electoral College, who voted for president and vice president.

<span class="mw-page-title-main">2000 United States presidential election in California</span>

The 2000 United States presidential election in California took place on November 7, 2000, as part of the wider 2000 United States presidential election. Voters chose 54 representatives, or electors to the Electoral College, who voted for president and vice president.

<span class="mw-page-title-main">1996 United States presidential election in California</span>

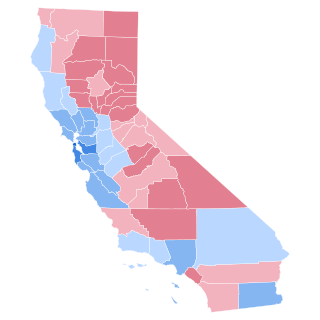
The 1996 United States presidential election in California took place on November 5, 1996, as part of the 1996 United States presidential election. Voters chose 54 representatives, or electors to the Electoral College, who voted for president and vice president. California, was won by Incumbent President Bill Clinton (D) over Senator Bob Dole (R), with Clinton winning 51.1% to 38.21% by a margin of 12.89%. Billionaire businessman Ross Perot finished in third, with 6.96% of the popular vote.

<span class="mw-page-title-main">2008 United States presidential election in North Carolina</span>

The 2008 United States presidential election in North Carolina was part of the national event on November 4, 2008, throughout all 50 states and D.C. In North Carolina, voters chose 15 representatives, or electors, to the Electoral College, who voted for president and vice president.

<span class="mw-page-title-main">2008 United States presidential election in Montana</span> Election in Montana

The 2008 United States presidential election in Montana took place on November 4, 2008, and was part of the 2008 United States presidential election. Voters chose three representatives, or electors to the Electoral College, who voted for president and vice president.

<span class="mw-page-title-main">2000 United States presidential election in Illinois</span>

The 2000 United States presidential election in Illinois took place on November 7, 2000, and was part of the 2000 United States presidential election. Voters chose 22 representatives, or electors to the Electoral College, who voted for president and vice president.

<span class="mw-page-title-main">2000 United States presidential election in Maryland</span> U.S. presidential election in Maryland

The 2000 United States presidential election in Maryland took place on November 7, 2000. Maryland participated in the 2000 United States presidential election along with the 49 other U.S. states and Washington, D.C. Voters chose 10 representatives, or electors, to the Electoral College, who voted for the President and Vice President.

<span class="mw-page-title-main">2000 United States presidential election in North Carolina</span>

The 2000 United States presidential election in North Carolina took place on November 7, 2000, and was part of the 2000 United States presidential election. Voters chose 14 representatives, or electors, to the Electoral College, who voted for president and vice president.

<span class="mw-page-title-main">1996 United States presidential election in Utah</span> Election in Utah

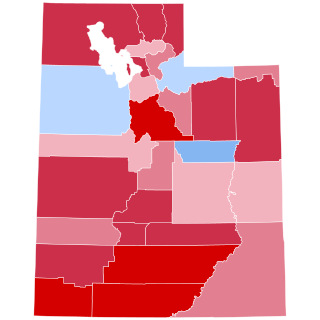
The 1996 United States presidential election in Utah took place on November 7, 1996, as part of the 1996 United States presidential election. Voters chose five representatives, or electors to the Electoral College, who voted for president and vice president.

<span class="mw-page-title-main">1996 United States presidential election in Georgia</span> Election in Georgia

The 1996 United States presidential election in Georgia took place on November 5, 1996, as part of the 1996 United States presidential election. Voters chose 13 representatives, or electors to the Electoral College, who voted for president and vice president.

<span class="mw-page-title-main">1996 United States presidential election in Arkansas</span> Election in Arkansas

The 1996 United States presidential election in Arkansas took place on November 5, 1996, as part of the 1996 United States presidential election. State voters chose six electors to the Electoral College, who voted for president and vice president.

<span class="mw-page-title-main">1992 United States presidential election in North Carolina</span>

The 1992 United States presidential election in North Carolina took place on November 3, 1992, and was part of the 1992 United States presidential election. Voters chose 14 representatives, or electors to the Electoral College, who voted for president and vice president.

<span class="mw-page-title-main">1996 United States presidential election in Iowa</span>

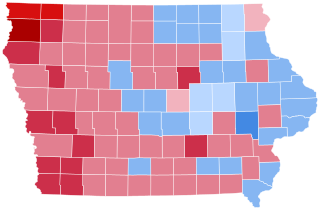
The 1996 United States presidential election in Iowa took place on November 5, 1996, as part of the 1996 United States presidential election. Voters chose seven representatives, or electors to the Electoral College, who voted for president and vice president.

<span class="mw-page-title-main">1996 United States presidential election in Colorado</span> Election in Colorado

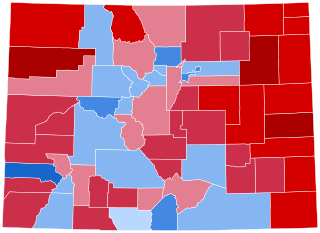
The 1996 United States presidential election in Colorado took place on November 7, 1996, as part of the 1996 United States presidential election. Voters chose eight representatives, or electors to the Electoral College, who voted for president and vice president.

<span class="mw-page-title-main">2016 United States presidential election in South Carolina</span> Election in South Carolina

The 2016 United States presidential election was held on November 8, 2016, as part of the 2016 General Election in which all 50 states plus the District of Columbia participated. South Carolina voters chose electors to represent them in the Electoral College via a popular vote pitting the Republican Party's nominee, businessman Donald Trump, and running mate Indiana Governor Mike Pence against Democratic Party nominee, former Secretary of State Hillary Clinton and her running mate, Virginia Senator Tim Kaine.

References

  1. Sullivan, Robert David (June 29, 2016). "How the Red and Blue Map Evolved Over the Past Century". The National Catholic Review (America Magazine ed.).
  2. Leip, Dave. "1996 Presidential General Election Results — North Carolina". Dave Leip’s U.S. Election Atlas.
  3. "NC US President Race, November 05, 1996". Our Campaigns.
  4. "List of States, Electoral Votes and electors". National Archives and Records Administration . Retrieved January 7, 2010.