1948 United States presidential election in North Carolina

Last updated

1948 United States presidential election in North Carolina
Flag of North Carolina (1885-1991).svg
  1944 November 2, 1948 [1] 1952  

All 14 North Carolina votes to the Electoral College
  Harry S Truman, bw half-length photo portrait, facing front, 1945 (cropped).jpg Thomas Dewey (3x4 crop).jpg Strom Thurmond 1948 (cropped).jpg
Nominee Harry S. Truman Thomas E. Dewey Strom Thurmond
Party Democratic Republican States’ Rights
Home state Missouri New York South Carolina
Running mate Alben W. Barkley Earl Warren Fielding L. Wright
Electoral vote1400
Popular vote459,070258,57269,652
Percentage58.02%32.68%8.80%

North Carolina Presidential Election Results 1948.svg
County results

President before election

Harry S. Truman
Democratic

Elected President

Harry S. Truman
Democratic

The 1948 United States presidential election in North Carolina took place on November 2, 1948, as part of the 1948 United States presidential election. North Carolina voters chose 14 [2] representatives, or electors, to the Electoral College, who voted for president and vice president.

Contents

As a former Confederate state, North Carolina had a history of Jim Crow laws, disfranchisement of its African-American population and dominance of the Democratic Party in state politics. However, unlike the Deep South, the Republican Party had sufficient historic Unionist white support from the mountains and northwestern Piedmont to gain one-third of the statewide vote total in most general elections, [3] where turnout was higher than elsewhere in the former Confederacy due substantially to the state’s early abolition of the poll tax in 1920. [4] Like Virginia, Tennessee and Oklahoma, the relative strength of Republican opposition meant that North Carolina did not have statewide white primaries, although certain counties did use the white primary. [5] Consequently, local response to the landmark 1944 court case of Smith v. Allwright was generally calm. [5]

Nevertheless, the state was highly dissatisfied with the influence of blacks and labor unions on the national Democratic Party, and was initially satisfied when liberal Vice-President Henry A. Wallace was replaced on the Democratic ticket in 1944. [6] However, by the beginning of 1946 most white North Carolinians were disapproving of President Truman, primarily because he appointed the first black federal judge and made overtures – though symbolic – toward civil rights. [6] When Truman actually developed a proposal for black civil rights titled To Secure These Rights , however, North Carolina was the only Southern state where there was relatively little overt anger, and the state provided the only three votes from the former Confederacy for Truman as Democratic nominee during the party’s 1948 National Convention. Combined with the persistent local Republican threat from mountain Unionist descendants, this meant that there was never any question of the state Democratic Party supporting South Carolina Governor Strom Thurmond.

9% of white voters supported Thurmond. [7]

Polls

SourceRankingAs of
Chattanooga Daily Times [8] Likely DOctober 15, 1948
The Montgomery Advertiser [9] Safe DOctober 24, 1948
The Miami News [10] Safe DOctober 25, 1948
The Charlotte Observer [11] Likely DOctober 27, 1948
Mount Vernon Argus [12] Lean DNovember 1, 1948
Oakland Tribune [13] Safe DNovember 1, 1948

Results

1948 United States presidential election in North Carolina
PartyCandidateVotes%
Democratic Harry S. Truman (inc.) 459,070 58.02%
Republican Thomas Dewey 258,57232.68%
States’ Rights Strom Thurmond 69,6528.80%
Progressive Henry A. Wallace 3,9150.49%
Total votes791,209 100%

Results by county

1948 United States presidential election in North Carolina by county [14]
County Harry S. Truman
Democratic
Thomas Edmund Dewey
Republican
James Strom Thurmond
States’ Rights
Henry Agard Wallace
Progressive
Margin
 %# %# %# %# %#
Greene 96.45%2,6872.33%651.18%330.04%194.11%2,622
Bertie 95.71%3,0342.68%851.48%470.13%493.03%2,949
Martin 95.53%4,6363.36%1631.07%520.04%292.17%4,473
Northampton 92.17%3,5914.59%1793.05%1190.18%787.58%3,412
Franklin 91.55%4,5384.72%2343.57%1770.16%886.83%4,304
Pitt 89.47%8,5196.32%6023.40%3240.81%7783.14%7,917
Edgecombe 89.75%6,4106.69%4783.00%2140.56%4083.06%5,932
Hertford 88.80%2,1658.04%1962.67%650.49%1280.76%1,969
Nash 88.50%7,5907.98%6843.38%2900.14%1280.53%6,906
Lenoir 88.54%5,4458.37%5152.63%1620.46%2880.16%4,930
Jones 88.05%1,2388.04%1133.70%520.21%380.01%1,125
Halifax 86.82%6,1727.10%5055.95%4230.13%979.72%5,667
Onslow 87.34%3,3188.32%3164.32%1640.03%179.02%3,002
Warren 85.75%2,3766.93%1927.25%2010.07%278.49% [lower-alpha 1] 2,175
Gates 86.94%9398.24%894.63%500.19%278.70%850
Granville 85.25%3,5138.10%3346.16%2540.49%2077.14%3,179
Wilson 86.25%6,0089.55%6653.57%2490.63%4476.70%5,343
Chowan 83.99%1,0709.73%1245.65%720.63%874.25%946
Currituck 83.63%1,1449.50%1306.36%870.51%774.12%1,014
Hoke 80.71%1,3398.56%14210.61%1760.12%270.10% [lower-alpha 1] 1,163
Person 82.28%3,08712.79%4804.80%1800.13%569.48%2,607
Craven 80.26%5,03911.87%7457.66%4810.21%1368.40%4,294
Vance 79.51%3,67911.87%5498.06%3730.56%2667.65%3,130
Perquimans 80.09%84912.74%1356.98%740.19%267.36%714
Duplin 81.25%5,86614.18%1,0244.47%3230.10%767.06%4,842
Robeson 77.26%7,05611.34%1,03610.79%9850.61%5665.91%6,020
Washington 81.43%1,67516.19%3331.70%350.68%1465.24%1,342
Anson 72.54%2,69212.05%44715.20%5640.22%857.34% [lower-alpha 1] 2,128
Beaufort 77.53%4,67517.50%1,0554.89%2950.08%560.03%3,620
Columbus 74.79%5,51115.00%1,10510.06%7410.16%1259.79%4,406
Bladen 72.33%2,83112.77%50014.67%5740.23%957.66% [lower-alpha 1] 2,257
Richmond 71.95%4,37614.24%86613.58%8260.23%1457.71%3,510
Camden 73.94%57616.30%1279.11%710.64%557.64%449
Scotland 69.42%1,95712.74%35917.45%4920.39%1151.97% [lower-alpha 1] 1,465
Hyde 76.05%80020.34%2143.61%380.00%055.70%586
Lee 74.38%3,23420.03%8715.47%2380.11%554.35%2,363
Caswell 68.82%1,65114.63%35116.22%3890.33%852.61% [lower-alpha 1] 1,262
Wake [lower-alpha 2] 73.45%17,93919.86%4,8505.90%1,4410.79%19353.59%13,089
Wayne 73.20%6,11119.86%1,6586.62%5530.31%2653.34%4,453
Union 66.23%3,40714.35%73819.23%9890.19%1047.01% [lower-alpha 1] 2,418
Harnett 74.11%6,60822.26%1,9853.50%3120.12%1151.85%4,623
Pender 62.39%1,33414.22%30421.94%4691.45%3140.46% [lower-alpha 1] 865
Johnston 70.69%9,18824.71%3,2114.39%5710.21%2745.99%5,977
Haywood 71.82%7,37326.14%2,6841.97%2020.07%745.68%4,689
Rockingham 68.89%8,55323.65%2,9367.24%8990.22%2745.24%5,617
Cleveland 65.21%6,03920.57%1,90513.77%1,2750.45%4244.64%4,134
Pasquotank 67.76%1,97624.04%7017.72%2250.48%1443.72%1,275
Durham [lower-alpha 3] 65.45%11,53025.72%4,5315.61%9893.20%56339.73%6,999
Carteret 67.66%3,49129.46%1,5202.60%1340.29%1538.20%1,971
Cumberland 55.13%4,99619.21%1,74125.26%2,2890.40%3629.87% [lower-alpha 1] 2,707
Tyrrell 65.77%73230.19%3363.86%430.18%235.58%396
Dare 66.06%80230.72%3733.05%370.16%235.34%429
Pamlico 62.36%1,37031.18%6856.14%1350.32%731.18%685
Orange 60.29%3,52331.03%1,8136.20%3622.48%14529.27%1,710
Chatham 58.60%3,39634.65%2,0086.59%3820.16%923.95%1,388
Jackson 59.55%4,00537.47%2,5202.74%1840.24%1622.08%1,485
Alamance 53.88%8,28733.32%5,12412.61%1,9390.20%3020.57%3,163
Yancey 59.69%3,48139.13%2,2821.13%660.05%320.56%1,199
New Hanover 47.92%5,36428.25%3,16223.24%2,6010.59%6619.67%2,202
Surry 56.77%6,95637.89%4,6435.13%6290.20%2518.88%2,313
Buncombe 55.34%17,07237.15%11,4606.94%2,1400.58%17918.19%5,612
Swain 56.67%1,90841.25%1,3891.96%660.12%415.41%519
McDowell 53.20%3,80537.88%2,7098.63%6170.29%2115.32%1,096
Graham 56.24%1,52741.07%1,1152.43%660.26%715.17%412
Gaston [lower-alpha 4] 47.27%8,96632.58%6,18019.80%3,7550.35%6714.69%2,786
Stokes 56.15%4,43141.71%3,2911.96%1550.18%1414.45%1,140
Rutherford 51.00%5,99236.95%4,34211.86%1,3940.19%2214.04%1,650
Polk 52.07%2,07840.99%1,6366.82%2720.13%511.07%442
Iredell 47.47%5,76136.59%4,44115.76%1,9130.17%2110.88%1,320
Moore 51.80%3,34142.16%2,7195.81%3750.23%159.64%622
Alleghany 51.43%1,66742.39%1,3745.86%1900.31%109.04%293
Guilford 48.73%17,22440.08%14,16710.06%3,5571.13%4018.65%3,057
Mecklenburg [lower-alpha 5] 43.24%14,35334.70%11,51821.61%7,1720.43%1428.54%2,835
Forsyth 49.35%12,20141.04%10,1476.79%1,6792.82%6988.31%2,054
Macon 52.46%2,78544.98%2,3882.45%1300.11%67.48%397
Rowan 43.30%6,79936.44%5,72220.04%3,1460.22%356.86%1,077
Cabarrus 39.44%5,05933.48%4,29426.80%3,4370.28%365.96%765
Montgomery 47.50%2,16543.33%1,9759.10%4150.07%34.17%190
Ashe 50.76%4,63346.74%4,2662.39%2180.11%104.02%367
Clay 50.76%1,30747.11%1,2131.90%490.23%63.65%94
Brunswick 43.82%2,05240.49%1,89615.27%7150.43%203.33%156
Cherokee 49.73%2,77146.93%2,6152.98%1660.36%202.80%156
Transylvania 48.27%2,97546.42%2,8615.05%3110.26%161.85%114
Caldwell 46.67%5,03346.24%4,9876.89%7430.20%220.43%46
Sampson 47.07%4,96546.76%4,9325.75%6070.42%440.31%33
Lincoln 42.71%3,57043.49%3,63513.58%1,1350.22%18-0.78%-65
Burke 46.16%6,22647.26%6,3746.47%8720.12%16-1.10%-148
Catawba 44.36%8,84447.50%9,4717.90%1,5760.23%46-3.14%-627
Davidson 46.15%7,99149.32%8,5394.33%7500.20%34-3.17%-548
Alexander 42.65%2,05747.98%2,3149.10%4390.27%13-5.33%-257
Watauga 45.66%3,37952.04%3,8512.14%1580.16%12-6.38%-472
Randolph 41.88%6,56753.39%8,3724.62%7240.12%19-11.51%-1,805
Stanly 37.82%4,41550.56%5,90211.39%1,3300.23%27-12.74%-1,487
Madison 42.67%2,55855.73%3,3411.32%790.28%17-13.06%-783
Davie 38.66%1,91754.02%2,6797.10%3520.22%11-15.37%-762
Wilkes 40.17%5,78457.18%8,2342.50%3600.15%22-17.01%-2,450
Henderson 34.38%3,31151.61%4,97113.69%1,3190.32%31-17.23%-1,660
Yadkin 35.10%2,08361.19%3,6313.51%2080.20%12-26.09%-1,548
Avery 23.28%93374.73%2,9951.77%710.22%9-51.45%-2,062
Mitchell 21.48%81876.35%2,9081.97%750.21%8-54.87%-2,090

Analysis

North Carolina was won by incumbent President Harry S. Truman (DMissouri), running with Senator Alben W. Barkley, with 58.02 percent of the popular vote, against Governor Thomas Dewey (RNew York), running with Governor Earl Warren, with 32.68 percent of the popular vote. [15] [16] North Carolina was the worst former Confederate state for Thurmond, and one of only two, the other being Texas, in which he did not win at least one county. Because the Black Belt of the state, unlike the economically conservative Black Belts of the Deep South, was economically more liberal than the Piedmont region where the establishment Democratic faction led since 1929 by O. Max Gardner was based, [17] its entirely white electorate stayed exceedingly loyal to Truman. The greatest support for Thurmond was instead found in middle- and upper-class urban areas of the Piedmont, [18] to such an extent that the best Dixiecrat counties correlated strongly with the largest urban areas. [19]

As of the 2020 presidential election , this is the last election in which Cabarrus County voted for a Democratic presidential candidate [20] This is also the last time a Democratic candidate won North Carolina by at least 15 points.

Notes

  1. 1 2 3 4 5 6 7 8 9 In this county where Thurmond ran second ahead of Dewey, margin given is Truman vote minus Thurmond vote and percentage margin Truman percentage minus Thurmond percentage.
  2. In this county there were two write-in votes for national Socialist Party of America candidate Norman Thomas.
  3. In this county there was one write-in vote for national Socialist candidate Norman Thomas and two votes for other write-in candidates.
  4. In this county there was one write-in vote for Socialist candidate Norman Thomas.
  5. In this county there were four write-in votes for national Socialist candidate Norman Thomas and five votes for other write-in candidates.

Related Research Articles

<span class="mw-page-title-main">1948 United States presidential election</span> 41st quadrennial U.S. presidential election

The 1948 United States presidential election was the 41st quadrennial presidential election. It was held on Tuesday, November 2, 1948. In one of the greatest election upsets in American history, incumbent President Harry S. Truman, the Democratic nominee, defeated heavily favored Republican Governor of New York Thomas E. Dewey, and third-party candidates, becoming the third president to succeed to the presidency upon his predecessor's death and be elected to a full term.

<span class="mw-page-title-main">Dixiecrat</span> 1948 U.S. segregationist political party

The States' Rights Democratic Party was a short-lived segregationist political party in the United States, active primarily in the South. It arose due to a Southern regional split in opposition to the regular Democratic Party. After President Harry S. Truman, the leader of the Democratic Party, ordered integration of the military in 1948 and other actions to address civil rights of African Americans, including the first presidential proposal for comprehensive civil and voting rights, many Southern white politicians who objected to this course organized themselves as a breakaway faction. They wished to protect the ability of states to maintain racial segregation. Its members were referred to as "Dixiecrats", a portmanteau of "Dixie", referring to the Southern United States, and "Democrat".

<span class="mw-page-title-main">1948 United States elections</span>

The 1948 United States elections were held on November 2, 1948. The election took place during the beginning stages of the Cold War. Democratic incumbent President Harry S. Truman was elected to a full term in an upset, defeating Republican nominee New York Governor Thomas E. Dewey and two erstwhile Democrats. The Democrats won back control of Congress from the Republicans. Until 2020, Democrats would never again flip a chamber of Congress in a presidential election cycle.

<span class="mw-page-title-main">1948 United States presidential election in Georgia</span> Election in Georgia

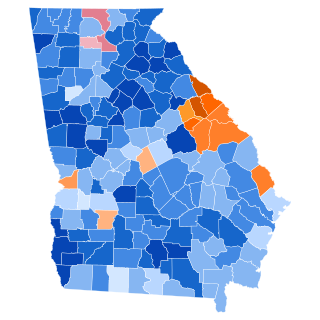
The 1948 United States presidential election in Georgia took place on November 2, 1948, as part of the wider United States presidential election. Voters chose 12 representatives, or electors, to the Electoral College, who voted for president and vice president.

<span class="mw-page-title-main">1948 United States presidential election in Virginia</span> Election in Virginia

The 1948 United States presidential election in Virginia took place on November 2, 1948, throughout the 48 contiguous states. Voters chose 11 representatives, or electors to the Electoral College, who voted for president and vice president.

<span class="mw-page-title-main">1948 United States presidential election in Texas</span> Election in Texas

The 1948 United States presidential election in Texas was held on November 2, 1948. Texas voters chose 23 electors to represent the state in the Electoral College, which chose the president and vice president.

<span class="mw-page-title-main">1948 United States presidential election in Mississippi</span> Election in Mississippi

The 1948 United States presidential election in Mississippi took place on November 2, 1948, in Mississippi as part of the wider United States presidential election of 1948.

<span class="mw-page-title-main">1948 United States presidential election in Alabama</span> Election in Alabama

The 1948 United States presidential election in Alabama was held on November 2, 1948. Alabama voters sent eleven electors to the Electoral College who voted for President and Vice-President. In Alabama, voters voted for electors individually instead of as a slate.

<span class="mw-page-title-main">1948 United States presidential election in Florida</span> Election in Florida

The 1948 United States presidential election in Florida was held on November 2, 1948. Voters chose eight electors, or representatives to the Electoral College, who voted for president and vice president.

<span class="mw-page-title-main">1964 United States presidential election in South Carolina</span> Election in South Carolina

The 1964 United States presidential election in South Carolina took place on November 3, 1964, as part of the 1964 United States presidential election. South Carolina voters chose 8 representatives, or electors, to the Electoral College, who voted for president and vice president.

<span class="mw-page-title-main">1956 United States presidential election in North Carolina</span>

The 1956 United States presidential election in North Carolina took place on November 6, 1956, as part of the 1956 United States presidential election. North Carolina voters chose 14 representatives, or electors, to the Electoral College, who voted for president and vice president.

<span class="mw-page-title-main">1952 United States presidential election in Alabama</span> Election in Alabama

The 1952 United States presidential election in Alabama took place on November 4, 1952, as part of the 1952 United States presidential election. Alabama voters chose eleven representatives, or electors, to the Electoral College, who voted for president and vice president. In Alabama, voters voted for electors individually instead of as a slate, as in the other states.

<span class="mw-page-title-main">1952 United States presidential election in South Carolina</span> Election in South Carolina

The 1952 United States presidential election in South Carolina took place on November 4, 1952, as part of the 1952 United States presidential election. South Carolina voters chose 8 representatives, or electors, to the Electoral College, who voted for president and vice president.

<span class="mw-page-title-main">1952 United States presidential election in North Carolina</span>

The 1952 United States presidential election in North Carolina took place on November 4, 1952, as part of the 1952 United States presidential election. North Carolina voters chose 14 representatives, or electors, to the Electoral College, who voted for president and vice president.

<span class="mw-page-title-main">1948 United States presidential election in South Carolina</span> Election in South Carolina

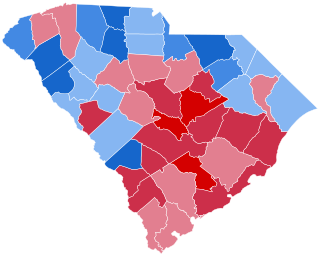
The 1948 United States presidential election in South Carolina took place on November 2, 1948, as part of the 1948 United States presidential election. State voters chose eight electors to the Electoral College, which selected the president and vice president.

<span class="mw-page-title-main">1948 United States presidential election in Arkansas</span> Election in Arkansas

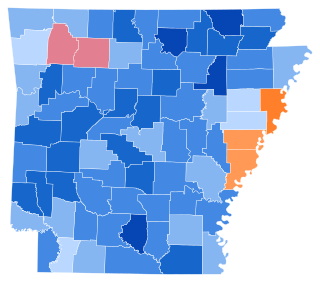
The 1948 United States presidential election in Arkansas took place on November 2, 1948, as part of the 1948 United States presidential election. State voters chose nine representatives, or electors, to the Electoral College, who voted for president and vice president. This would be the last presidential election where Arkansas had nine electoral votes: the Great Migration would see the state lose three congressional districts in the next decade-and-a-half.

<span class="mw-page-title-main">1948 United States presidential election in Tennessee</span> Election in Tennessee

The 1948 United States presidential election in Tennessee took place on November 2, 1948, as part of the 1948 United States presidential election. Tennessee voters chose 12 representatives, or electors, to the Electoral College, who voted for president and vice president.

<span class="mw-page-title-main">1948 United States presidential election in Wyoming</span> Election in Wyoming

The 1948 United States presidential election in Wyoming took place on November 2, 1948, as part of the 1948 United States presidential election. State voters chose three representatives, or electors, to the Electoral College, who voted for president and vice president. Wyoming was won by incumbent Democratic President Harry S. Truman, running with Senate Majority Leader Alben W. Barkley, with 51.62 percent of the popular vote, against the Republican nominee, 47th Governor of New York Thomas E. Dewey, running with California Governor and future Chief Justice of the United States Earl Warren, with 47.27 percent of the popular vote, despite the fact that Dewey had previously won the state four years earlier.

<span class="mw-page-title-main">1948 United States presidential election in Louisiana</span> Election in Louisiana

The 1948 United States presidential election in Louisiana took place on November 2, 1948, as part of the 1948 United States presidential election. State voters chose ten representatives, or electors, to the Electoral College, who voted for president and vice president.

<span class="mw-page-title-main">1944 United States presidential election in Mississippi</span> Election in Mississippi

The 1944 United States presidential election in Mississippi took place on November 7, 1944, as part of the 1944 United States presidential election. Mississippi voters chose nine representatives, or electors, to the Electoral College, who voted for president and vice president.

References

  1. "United States Presidential election of 1948 – Encyclopædia Britannica" . Retrieved October 31, 2017.
  2. "1948 Election for the Forty-First Term (1949-53)" . Retrieved October 31, 2017.
  3. Phillips, Kevin P.; The Emerging Republican Majority, pp. 210, 242 ISBN   978-0-691-16324-6
  4. Key, Valdimer Orlando; Southern Politics in State and Nation, p. 502, Alfred A. Knopf (1949)
  5. 1 2 Klarman, Michael J. (2001). "The White Primary Rulings: A Case Study in the Consequences of Supreme Court Decision-Making". Florida State University Law Review. 29: 55–107.
  6. 1 2 Grayson, A.G. (December 1975). "North Carolina and Harry Truman, 1944-1948". Journal of American Studies. 9 (3): 283–300.
  7. Black & Black 1992, p. 147.
  8. Gallup, George (October 15, 1948). "Only Four States Go to Dixiecrats". Chattanooga Daily Times . Chattanooga, Tennessee. p. 6-A.
  9. Moss, Charles (October 24, 1948). "Tennessee". The Montgomery Advertiser . Montgomery, Alabama. p. 16.
  10. Ragan, Sam (October 25, 1948). "North Carolina". The Miami News . Miami, Florida. p. 8.
  11. Stokes, Thomas (October 27, 1948). "Washington with Thomas Stokes". The Charlotte Observer . Charlotte, North Carolina. p. 6-A.
  12. Tucker, Ray (November 1, 1948). "Truman Whistling in a White House Graveyard, Says Tucker, Predicting It'll Be a Dewey Sweep". Mount Vernon Argus. Mount Vernon, New York. p. 8.
  13. Gallup, George (November 1, 1948). "Final Gallup Poll Shows Dewey Winning Election with Wide Electoral Vote Margin". Oakland Tribune . Oakland, California. pp. 1–2.
  14. "NC US President Race, November 02, 1948". Our Campaigns.
  15. "1948 Presidential General Election Results – North Carolina" . Retrieved October 31, 2017.
  16. "The American Presidency Project – Election of 1948" . Retrieved October 31, 2017.
  17. Key, Southern Politics in State and Nation, pp. 215-217
  18. Phillips; The Emerging Republican Majority, p. 297
  19. See Strong, Donald S. (August 1955). "The Presidential Election in the South, 1952". The Journal of Politics. 17 (3): 343–389.
  20. Sullivan, Robert David (June 29, 2016). "How the Red and Blue Map Evolved Over the Past Century". The National Catholic Review (America Magazine ed.).

Works cited