Hartford County, Connecticut

Last updated

Hartford County
Hartford seen from Heublein Tower.jpg
Hartford Connecticut Skyline.JPG
New Britain.jpg
Silas W. Robbins House (1873), Old Wethersfield Historic District, Connecticut.JPG
Old State House, Hartford CT - detail.JPG
Top-bottom, left-right: Hartford County skyline from Heublein Tower, the Hartford skyline, the New Britain skyline, a house in Old Wethersfield, and the Old State House in Hartford.
Map of Connecticut highlighting Hartford County.svg
Location within the U.S. state of Connecticut
Connecticut in United States.svg
Connecticut's location within the U.S.
Coordinates: 41°49′N72°44′W / 41.81°N 72.73°W / 41.81; -72.73
CountryFlag of the United States.svg United States
StateFlag of Connecticut.svg  Connecticut
FoundedMay 10, 1666
Named for Hertfordshire, England
Seat none (since 1960), Hartford (before 1960)
Largest municipalityHartford (population)
Glastonbury (area)
Area
  Total750 sq mi (1,900 km2)
  Land735 sq mi (1,900 km2)
  Water16 sq mi (40 km2)  2.1%
Population
 (2020)
  Total899,498 Increase2.svg
  Density1,199.3/sq mi (463.1/km2)
Congressional districts 1st, 2nd, 5th
Hartford County, Connecticut
Interactive map of Hartford County, Connecticut

Hartford County is a county located in the north central part of the U.S. state of Connecticut. According to the 2020 census, the population was 899,498, [1] making it the second-most populous county in Connecticut. Hartford County contains the city of Hartford, the state capital of Connecticut and the county's most populous city, with 121,054 residents at the 2020 census. [2] Hartford County is included in the Hartford-East Hartford-Middletown metropolitan statistical area.

Contents

On June 6, 2022, the U.S. Census Bureau formally recognized Connecticut's nine councils of governments as county equivalents instead of the state's eight counties. Connecticut's county governments were disbanded in 1960, and the councils of governments took over some of the local governmental functions. Connecticut's eight historical counties continue to exist in name only, and are no longer considered for statistical purposes. [3]

History

Hartford County was one of four original counties in Connecticut established on May 10, 1666, by an act of the Connecticut General Court. The act establishing the county states:

This Court orders that the Townes on the River from yee
north bounds of Windsor wth Farmington to ye south end of
ye bounds of Thirty Miles Island shalbe & remaine to be one
County wch shalbe called the County of Hartford. And it
is ordered that the County Court shalbe kept at Hartford on
the 1st Thursday in March and on the first Thursday in September yearely. [4]

As established in 1666, Hartford County consisted of the towns of Windsor, Wethersfield, Hartford, Farmington, and Middletown. The "Thirty Miles Island" referred to in the constituting Act was incorporated as the town of Haddam in 1668. [5] In 1670, the town of Simsbury was established, extending Hartford County to the Massachusetts border. In the late 17th to early 18th centuries, several more towns were established and added to Hartford County: Waterbury in 1686 (transferred to New Haven County in 1728), Windham in 1694 (transferred to Windham County in 1726), Hebron in 1708 (transferred to Tolland County in 1785), Coventry in 1712 (transferred to Windham County in 1726), and Litchfield in 1722 (transferred to Litchfield County in 1751).

In 1714, all of the unincorporated territory north of the towns of Coventry and Windham in northeastern Connecticut to the Massachusetts border were placed under the jurisdiction of Hartford County. Windham County was constituted in 1726, resulting in Hartford County losing the towns of Windham, Coventry, Mansfield (incorporated in 1702), and Ashford (incorporated in 1714). Northwestern Connecticut, which was originally placed under the jurisdiction of New Haven County in 1722, was transferred to Hartford County by 1738. All of northwestern Connecticut was later constituted as the new Litchfield County in 1751. In 1785, two more counties were established in what was now the U.S. state of Connecticut: Tolland and Middlesex. This mostly resulted in the modern extent of Hartford County. In the late 18th and early 19th centuries, the establishment of several more towns resulted in minor adjustments in the bounds of the county. The final adjustment resulting in the modern limits occurred on May 8, 1806, when the town of Canton was established. [6]

Geography

According to the U.S. Census Bureau in 2010, the county had a total area of 751 square miles (1,950 km2), of which 735 square miles (1,900 km2) is land and 16 square miles (41 km2) (2.1%) is water. [7] It is the second-largest county in Connecticut by land area.

The county is divided into two unequal parts by the Connecticut River, and watered by Farmington, Mill, Podunk, Scantic, and other rivers. The surface is very diverse: part of the river valleys are alluvial and subject to flooding, while other portions of the county are hilly and even mountainous. [8]

Adjacent counties

Communities

In Connecticut, there is no county-level executive or legislative government; the counties determine probate, civil and criminal court boundaries, but little else. Each city or town is responsible for local services such as schools, snow removal, sewers, fire department and police departments. In Connecticut, cities and towns may agree to jointly provide services or establish a regional school system.

Cities

Towns

Demographics

Historical population
CensusPop.Note
1790 38,149
1800 42,14710.5%
1810 44,7336.1%
1820 47,2645.7%
1830 51,1318.2%
1840 55,6298.8%
1850 69,96725.8%
1860 89,96228.6%
1870 109,00721.2%
1880 125,38215.0%
1890 147,18017.4%
1900 195,48032.8%
1910 250,18228.0%
1920 336,02734.3%
1930 421,09725.3%
1940 450,1896.9%
1950 539,66119.9%
1960 689,55527.8%
1970 816,73718.4%
1980 807,766−1.1%
1990 851,7835.4%
2000 857,1830.6%
2010 894,0144.3%
2020 899,4980.6%
U.S. Decennial Census [9]
1790–1960 [10] 1900–1990 [11]
1990–2000 [12] 2010–2018 [13]

2000 census

As of the census [14] of 2000, there were 857,183 people, 335,098 households, and 222,505 families living in the county. The population density was 1,166 inhabitants per square mile (450/km2). There were 353,022 housing units at an average density of 480 per square mile (190/km2). The racial makeup of the county was 76.90% White, 11.66% Black or African American, 0.23% Native American, 2.42% Asian, 0.04% Pacific Islander, 6.43% from other races, and 2.31% from two or more races. 11.55% of the population were Hispanic or Latino of any race. 15.2% were of Italian, 11.2% Irish, 9.1% Polish, 6.5% English, 5.7% French and 5.3% German ancestry. 78.4% spoke English, 10.3% Spanish, 2.6% Polish, 1.9% French and 1.6% Italian as their first language.

There were 335,098 households, out of which 31.30% had children under the age of 18 living with them, 49.20% were married couples living together, 13.50% had a female householder with no husband present, and 33.60% were non-families. 27.90% of all households were made up of individuals, and 10.70% had someone living alone who was 65 years of age or older. The average household size was 2.48 and the average family size was 3.05.

In the county, the population was spread out, with 24.60% under the age of 18, 7.80% from 18 to 24, 29.80% from 25 to 44, 23.20% from 45 to 64, and 14.70% who were 65 years of age or older. The median age was 38 years. For every 100 females, there were 92.70 males. For every 100 females age 18 and over, there were 89.00 males.

The median income for a household in the county was $50,756, and the median income for a family was $62,144. Males had a median income of $43,985 versus $33,042 for females. The per capita income for the county was $26,047. About 7.10% of families and 9.30% of the population were below the poverty line, including 12.90% of those under age 18 and 7.60% of those age 65 or over.

2010 census

As of the 2010 United States Census, there were 894,014 people, 350,854 households, and 227,831 families living in the county. [15] The population density was 1,216.2 inhabitants per square mile (469.6/km2). There were 374,249 housing units at an average density of 509.1 per square mile (196.6/km2). [16] The racial makeup of the county was 72.4% white, 13.3% black, 4.2% Asian, 0.3% American Indian, 7.1% from other races, and 2.7% from two or more races. Those of Hispanic origin made up 15.3% of the population. [15] In terms of ancestry, 15.9% were Italian, 15.6% were Irish, 10.7% were Polish, 9.4% were English, 8.8% were German, and 2.5% were American. [17]

Of the 350,854 households, 31.9% had children under the age of 18 living with them, 46.0% were married couples living together, 14.5% had a female householder with no husband present, 35.1% were non-families, and 28.7% of all households were made up of individuals. The average household size was 2.47 and the average family size was 3.06. The median age was 39.9 years. [15]

The median income for a household in the county was $62,590 and the median income for a family was $78,599. Males had a median income of $56,181 versus $44,273 for females. The per capita income for the county was $33,151. About 8.0% of families and 10.7% of the population were below the poverty line, including 15.3% of those under age 18 and 7.7% of those age 65 or over. [18]

Demographic breakdown by town

Income

Data is from the 2010 United States Census and the 2006–2010 American Community Survey 5-Year Estimates. [19] [20]

RankTownPer capita
income
Median
household
income
Median
family
income
PopulationNumber of
households
Pop. Density
1 Glastonbury Town$73,020$127,237$145,32134,42712,866670
2 Avon Town$55,879$105,116$129,65118,0987,009770
3 Simsbury Town$54,571$113,224$135,77223,5118,776685
4 Farmington Town$50,541$85,417$106,88525,34010,522881
5 Granby Town$46,687$97,500$111,33911,2824,194277
6 Canton Town$46,401$87,643$101,79310,2924,150412
7 West Hartford Town$43,534$78,530$102,54763,26825,2582,837
8 Burlington Town$43,392$115,341$120,5809,3013,291306
9 Marlborough Town$41,669$108,232$110,5276,4042,292272
10 Suffield Town$41,098$90,023$99,85515,7355,155366
11 East Granby Town$40,698$77,596$97,1745,1482,062291
12 Bloomfield Town$39,738$68,372$84,58320,4868,554779
13 South Windsor Town$38,945$88,350$94,60225,7099,918896
14 Berlin Town$38,134$86,211$98,67719,8667,808736
15 Wethersfield Town$37,329$71,284$91,56326,66811,2042,036
16 Hartland Town$36,874$85,956$91,1882,11478961
17 Southington Town$36,053$77,673$102,18643,06916,8141,177
18 Rocky Hill Town$36,021$72,417$88,75019,7098,3071,426
19 Windsor Town$35,780$78,695$90,85629,04411,233937
20 Manchester Town$32,752$61,571$77,01858,24124,6892,103
21 Newington Town$32,561$69,085$80,59730,56212,5502,333
22 East Windsor Town$31,162$64,301$76,50211,1624,750416
23 Plainville Town$31,000$63,447$80,20517,7167,5801,814
24 Windsor Locks Town$30,436$59,369$70,43912,4985,2231,330
25 Bristol City$29,629$58,537$72,03860,47725,3202,257
26 Enfield Town$29,340$67,402$77,55444,65416,7941,306
27 East Hartford Town$24,373$48,613$57,84851,25220,1952,741
28 New Britain City$21,056$39,706$45,99073,20628,1585,463
29 Hartford City$16,798$28,970$32,820124,77545,1246,932

Race

Data is from the 2007-2011 American Community Survey 5-Year Estimates, ACS Demographic and Housing Estimates, "Race alone or in combination with one or more other races." [21]

RankTownPopulationWhiteBlackAsianAmerican
Indian
OtherHispanic
1 Hartford City124,81735.1%39.8%2.9%1.5%25.1%42.4%
2 New Britain City73,05568.2%15.3%2.7%0.5%17.2%34.8%
3 West Hartford Town63,06684.6%7.4%8.2%0.7%2.3%9.1%
4 Bristol City60,47390.0%5.1%2.3%0.8%4.9%9.5%
5 Manchester Town57,89777.0%11.7%7.8%0.6%5.6%12.5%
6 East Hartford Town51,09154.4%25.4%7.3%0.9%15.5%25.7%
7 Enfield Town44,74788.5%7.4%2.1%0.4%3.5%7.2%
8 Southington Town42,73196.3%1.2%1.8%0.2%1.0%3.4%
9 Glastonbury Town34,17187.7%4.1%7.0%0.4%2.2%4.6%
10 Newington Town30,44186.9%6.0%6.3%0.6%2.5%7.2%
11 Windsor Town28,96256.4%37.6%5.0%0.5%3.7%8.4%
12 Wethersfield Town26,64192.4%3.4%1.8%0.5%3.3%8.8%
13 South Windsor Town25,57784.7%5.2%8.4%0.4%2.9%5.3%
14 Farmington Town25,18690.0%3.0%7.8%0.4%0.3%1.3%
15 Simsbury Town23,49894.3%2.3%4.0%0.5%0.4%2.3%
16 Bloomfield Town20,40640.1%59.0%1.7%2.6%1.4%3.7%
17 Berlin Town19,69494.3%1.5%2.7%0.4%1.9%2.7%
18 Rocky Hill Town19,53378.7%4.9%13.9%1.6%3.2%6.5%
19 Avon Town17,85990.5%2.3%8.0%0.5%1.0%4.2%
20 Plainville Town17,67095.7%2.9%2.3%0.3%1.0%4.7%
21 Suffield Town15,51386.3%9.6%1.5%1.5%4.0%5.8%
22 Windsor Locks Town12,46689.1%4.2%6.0%1.1%1.2%3.6%
23 Granby Town11,19296.1%2.7%1.2%0.1%1.3%4.0%
24 East Windsor Town11,02483.2%10.2%6.9%0.6%0.9%5.5%
25 Canton Town10,13999.0%0.6%1.1%0.5%0.4%2.6%
26 Burlington Town9,19197.8%1.1%1.5%0.1%0.3%2.5%
27 Marlborough Town6,33598.8%1.0%0.5%0.7%0.5%1.6%
28 East Granby Town5,05589.9%2.4%6.9%0.2%1.3%4.3%
29 Hartland Town2,15897.5%0.9%2.1%0.4%0.2%0.3%

Transportation

Major highways

Public transportation

Politics

Prior to 1960, Hartford County was a Republican-leaning swing county in presidential elections. Since then, it has become solidly Democratic similar to most of New England, with the only Republicans to carry the county since then being Richard Nixon and Ronald Reagan in their 49-state landslide victories of 1972 and 1984, respectively.

United States presidential election results for Hartford County, Connecticut [22]
Year Republican Democratic Third party
No.%No.%No.%
2020 159,02435.39%283,36863.06%6,9441.55%
2016 148,17336.42%240,40359.09%18,2884.49%
2012 143,23836.52%244,63962.37%4,3631.11%
2008 138,98433.67%268,72165.11%5,0231.22%
2004 154,91939.54%229,90258.68%6,9871.78%
2000 127,46834.68%221,16760.17%18,9215.15%
1996 111,56631.26%203,54957.04%41,72611.69%
1992 132,59131.96%195,49547.13%86,71820.91%
1988 173,03145.95%199,85753.08%3,6480.97%
1984 208,21055.02%168,60944.56%1,5860.42%
1980 150,26540.46%164,64344.33%56,47215.21%
1976 175,06447.51%191,25751.90%2,1730.59%
1972 194,09552.09%174,83746.93%3,6540.98%
1968 131,74038.78%190,86556.19%17,0965.03%
1964 88,81126.95%240,07172.86%6220.19%
1960 136,45941.12%195,40358.88%20.00%
1956 175,89458.09%126,92341.91%00.00%
1952 150,33250.50%146,55149.23%8310.28%
1948 105,26244.74%124,87453.07%5,1572.19%
1944 95,22442.47%127,84157.02%1,1530.51%
1940 88,15543.44%114,33656.34%4620.23%
1936 65,65237.23%103,45058.67%7,2164.09%
1932 72,61148.36%72,32248.17%5,2203.48%
1928 75,99753.16%65,78946.02%1,1690.82%
1924 61,38161.93%28,13928.39%9,5919.68%
1920 54,04660.74%30,28734.04%4,6465.22%
1916 23,26546.75%24,39849.03%2,1024.22%
1912 16,96139.09%16,75638.62%9,67422.29%
1908 24,78161.36%12,96732.11%2,6376.53%
1904 23,86557.67%16,00438.67%1,5133.66%
1900 22,42559.25%14,49038.29%9312.46%
1896 30,26157.88%20,21238.66%1,8133.47%
1892 20,03843.51%24,63353.48%1,3873.01%
1888 19,00345.04%22,11352.41%1,0732.54%
1884 16,31744.48%19,32452.67%1,0462.85%

Education

School districts include: [23]

K-12:

Secondary districts:

Elementary districts:

See also

Related Research Articles

<span class="mw-page-title-main">New Haven County, Connecticut</span> County in Connecticut, United States

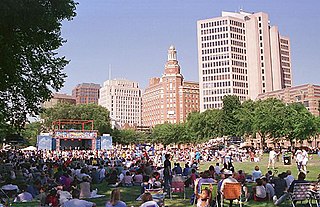
New Haven County is a county in the south central part of the U.S. state of Connecticut. As of the 2020 census, the population was 864,835, making it the third-most populous county in Connecticut. Two of the state's top 5 largest cities, New Haven (3rd) and Waterbury (5th), are part of New Haven County.

<span class="mw-page-title-main">New London County, Connecticut</span> County in Connecticut, United States

New London County is in the southeastern corner of Connecticut and comprises the Norwich-New London, Connecticut Metropolitan Statistical Area, which is also included in the Hartford-East Hartford, Connecticut Combined Statistical Area. There is no county government and no county seat, as is the case with all eight of Connecticut's counties; towns are responsible for all local government activities, including fire and rescue, snow removal, and schools.

<span class="mw-page-title-main">Tolland County, Connecticut</span> County in Connecticut, United States

Tolland County is a county in the northeastern part of the U.S. state of Connecticut. As of the 2020 census, its population was 149,788. It is incorporated into 13 towns and was originally formed on October 13, 1785, from portions of eastern Hartford County and western Windham County.

<span class="mw-page-title-main">Windham County, Connecticut</span> County in Connecticut, United States

Windham County is one of the eight historical counties in the U.S. state of Connecticut, located in its northeastern corner. As of the 2020 census, the population was 116,418, making it the least populous county in Connecticut. It forms the core of the region known as the Quiet Corner. Windham County is included in the Worcester, MA-CT Metropolitan Statistical Area, which is also included in the Boston-Worcester-Providence, MA-RI-NH-CT Combined Statistical Area. The entire county is within the Quinebaug and Shetucket Rivers Valley National Heritage Corridor, as designated by the National Park Service.

<span class="mw-page-title-main">Windsor County, Vermont</span> County in Vermont, United States

Windsor County is a county located in the U.S. state of Vermont. As of the 2020 census, the population was 57,753. The shire town is the town of Woodstock. The county's largest municipality is the town of Hartford.

<span class="mw-page-title-main">Bloomfield, Connecticut</span> Town in Connecticut, United States

Bloomfield is a suburb of Hartford in the Capitol Planning Region, Connecticut, United States. The town's population was 21,535 at the 2020 census. Bloomfield is best known as the headquarters of healthcare services company Cigna.

<span class="mw-page-title-main">Blue Hills, Connecticut</span> Place in Connecticut, United States

Blue Hills is a community in Hartford County, Connecticut, encompassing the northwest corner of the city of Hartford and the southeast corner of the town of Bloomfield. The Bloomfield portion is listed by the U.S. Census Bureau as a census-designated place (CDP), with a population of 2,762 at the 2020 census.

<span class="mw-page-title-main">Canton, Connecticut</span> Town in Connecticut, United States

Canton is a town, incorporated in 1806, located in the Farmington Valley section of the Capitol Planning Region, Connecticut, United States. The population was 10,124 as of the 2020 census. It is bordered by Granby on the north, Simsbury on the east, Avon and Burlington on the south, New Hartford on the west, and Barkhamsted on the northwest. Running through it is the Farmington River. The town includes the villages of North Canton, Canton Center, Canton, and Collinsville. In September 2007, Collinsville was ranked in Budget Travel magazine as one of the "Ten Coolest Small Towns In America".

<span class="mw-page-title-main">Kensington, Connecticut</span> Census-designated place in Connecticut, United States

Kensington is a census-designated place (CDP) and section of the town of Berlin in Hartford County, Connecticut, United States. The Berlin town offices are located in Kensington. The population was 8,459 at the 2010 census.

<span class="mw-page-title-main">North Granby, Connecticut</span> Census-designated place in Connecticut, United States

North Granby is a village and census-designated place (CDP) in Hartford County, Connecticut, United States. It is part of the town of Granby. The population was 1,944 at the 2010 census.

<span class="mw-page-title-main">Tariffville, Connecticut</span> Census-designated place in Connecticut, United States

Tariffville is a neighborhood and census-designated place (CDP) in the town of Simsbury in Hartford County, Connecticut, United States. The population was 1,324 at the 2010 census. It is a popular location for whitewater paddlers who use the Farmington River.

<span class="mw-page-title-main">Windsor, Connecticut</span> Town in Connecticut, United States

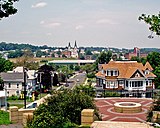
Windsor is a town in Hartford County, Connecticut, United States, and was the first English settlement in the state. It lies on the northern border of Connecticut's capital, Hartford. The town is part of the Capitol Planning Region. The population of Windsor was 29,492 at the 2020 census.

<span class="mw-page-title-main">Barkhamsted, Connecticut</span> Town in Connecticut, United States

Barkhamsted is a town in Litchfield County, Connecticut, United States. It contains seven villages: West Hill, Mallory, Barkhamsted Center, Center Hill, Washington Hill, Pleasant Valley, and Riverton. The population was 3,647 at the 2020 census, down from 3,799 at the 2010 census. The town is part of the Northwest Hills Planning Region. Barkhamsted was first incorporated in 1779, and named after Berkhamsted, Hertfordshire, England.

<span class="mw-page-title-main">Terryville, Connecticut</span> Census-designated place in Plymouth, Connecticut, US

Terryville is a census-designated place (CDP) in Litchfield County, Connecticut, United States, and is the largest village within the town of Plymouth. In the 2010 census, Terryville had a population of 5,387, out of 12,243 in the entire town of Plymouth. The village is named for Eli Terry Jr., the son of the well-known clockmaker Eli Terry Sr. Terryville is also home to the Lock Museum of America. There is a water wheel located in downtown Terryville that is dedicated to the son of Eli Terry Sr.

<span class="mw-page-title-main">Winchester, Connecticut</span> Town in Connecticut, United States

Winchester is a town in Litchfield County, Connecticut, United States. The population was 10,224 at the 2020 census. The city of Winsted is located in Winchester. The town is part of the Northwest Hills Planning Region.

<span class="mw-page-title-main">Eastford, Connecticut</span> Town in Connecticut, United States

Eastford is a town in Windham County, Connecticut, United States. The town is part of the Northeastern Connecticut Planning Region. The population was 1,649 at the 2020 census.

<span class="mw-page-title-main">Windham, Connecticut</span> Town in Connecticut, United States

Windham is a town in Windham County, Connecticut, United States. It contains the former city of Willimantic as well as the communities of Windham Center, North Windham, and South Windham. Willimantic, an incorporated city since 1893, was consolidated with the town in 1983. The town is part of the Southeastern Connecticut Planning Region. The population was 24,428 at the 2020 census.

<span class="mw-page-title-main">Southwick, Massachusetts</span> Town in Massachusetts, United States

Southwick is a town in Hampden County, Massachusetts, United States. The population was 9,232 at the 2020 census, down from 9,502 at the 2010 census. It is part of the Springfield, Massachusetts Metropolitan Statistical Area.

<span class="mw-page-title-main">New Hartford Center, Connecticut</span> Census-designated place in Connecticut, United States

New Hartford Center is a census-designated place (CDP) in Litchfield County, Connecticut, United States. It comprises the village of New Hartford, the adjacent Pine Meadow Historic District, and some surrounding forest land, all within the town of New Hartford. As of the 2010 census, the population of New Hartford Center was 1,385, out of 6,970 in the entire town of New Hartford.

<span class="mw-page-title-main">Salmon Brook, Connecticut</span> Census-designated place in Connecticut, United States

Salmon Brook is the name of a census-designated place (CDP) corresponding to the village of Granby, the primary settlement of the town of Granby, Connecticut, in Hartford County. The population of the CDP was 2,324 as of the 2010 census.

References

  1. "Census - Geography Profile: Hartford County, Connecticut". United States Census Bureau . Retrieved November 20, 2021.
  2. "Census - Geography Profile: Hartford city, Connecticut" . Retrieved November 20, 2021.
  3. https://www.federalregister.gov/documents/2022/06/06/2022-12063/change-to-county-equivalents-in-the-state-of-connecticut Federal Register: Change to County-Equivalents in the State of Connecticut
  4. "CCR: Volume 02, Page 39". Archived from the original on April 28, 2007. Retrieved June 17, 2008.
  5. "Haddam Historical Society - History of Haddam". haddamhistory.org. Retrieved June 18, 2020.
  6. Newberry Library – Connecticut Atlas of Historical County Boundaries Archived November 10, 2013, at the Wayback Machine
  7. "US Gazetteer files: 2010, 2000, and 1990". United States Census Bureau. February 12, 2011. Retrieved April 23, 2011.
  8. Ripley, George; Dana, Charles A., eds. (1879). "Hartford, a N. county of Connecticut"  . The American Cyclopædia .
  9. "U.S. Decennial Census". United States Census Bureau. Retrieved June 11, 2014.
  10. "Historical Census Browser". University of Virginia Library. Retrieved June 11, 2014.
  11. "Population of Counties by Decennial Census: 1900 to 1990". United States Census Bureau. Retrieved June 11, 2014.
  12. "Census 2000 PHC-T-4. Ranking Tables for Counties: 1990 and 2000" (PDF). United States Census Bureau. Archived (PDF) from the original on October 9, 2022. Retrieved June 11, 2014.
  13. "State & County QuickFacts". United States Census Bureau. Archived from the original on June 7, 2011. Retrieved June 11, 2014.
  14. "U.S. Census website". United States Census Bureau . Retrieved May 14, 2011.
  15. 1 2 3 "DP-1 Profile of General Population and Housing Characteristics: 2010 Demographic Profile Data". United States Census Bureau. Archived from the original on February 13, 2020. Retrieved January 12, 2016.
  16. "Population, Housing Units, Area, and Density: 2010 - County". United States Census Bureau. Archived from the original on February 13, 2020. Retrieved January 12, 2016.
  17. "DP02 SELECTED SOCIAL CHARACTERISTICS IN THE UNITED STATES – 2006-2010 American Community Survey 5-Year Estimates". United States Census Bureau. Archived from the original on February 13, 2020. Retrieved January 12, 2016.
  18. "DP03 SELECTED ECONOMIC CHARACTERISTICS – 2006-2010 American Community Survey 5-Year Estimates". United States Census Bureau. Archived from the original on February 13, 2020. Retrieved January 12, 2016.
  19. "SELECTED ECONOMIC CHARACTERISTICS 2006-2010 American Community Survey 5-Year Estimates". U.S. Census Bureau. Archived from the original on February 12, 2020. Retrieved November 25, 2012.
  20. "Profile of General Population and Housing Characteristics: 2010 Demographic Profile Data". U.S. Census Bureau. Archived from the original on May 21, 2019. Retrieved November 25, 2012.
  21. "ACS DEMOGRAPHIC AND HOUSING ESTIMATES 2007-2011 American Community Survey 5-Year Estimates". U.S. Census Bureau. Archived from the original on February 12, 2020. Retrieved January 8, 2013.
  22. Leip, David. "Dave Leip's Atlas of U.S. Presidential Elections". uselectionatlas.org. Retrieved May 26, 2017.
  23. "2020 CENSUS - SCHOOL DISTRICT REFERENCE MAP: Hartford County, CT" (PDF). U.S. Census Bureau. Archived (PDF) from the original on October 9, 2022. Retrieved July 22, 2022. - Text list

41°49′N72°44′W / 41.81°N 72.73°W / 41.81; -72.73